Operating review
Gas distribution on the National Transportation Network
Gas volumes are expressed in standard cubic metres (Smc) with a traditional higher heating value (HHV) of 38.1 Mj/Smc (10.572 Kwh/Smc).The basic figure is measured in energy (MJ) and obtained by multiplying the physical cubic metres actually measured by the relative heating value.
| Download XLS (17 kB) |
(billions of m3) |
2015 |
2016 (*) |
2017 |
Change |
Change % (**) |
||||||||
|
|||||||||||||
Residential and tertiary |
28.97 |
28.86 |
29.48 |
0.62 |
2.1 |
||||||||
Thermoelectric |
20.62 |
23.43 |
25.36 |
1.93 |
8.2 |
||||||||
Industrial (***) |
15.97 |
16.58 |
17.80 |
1.22 |
7.3 |
||||||||
Other (****) |
1.96 |
2.04 |
2.50 |
0.46 |
22.9 |
||||||||
|
67.52 |
70.91 |
75.14 |
4.23 |
6.0 |
||||||||
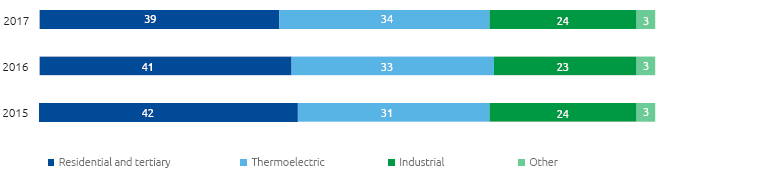
The gas demand in Italy in 2017 was 75.14 billion cubic metres, up 4.23 billion cubic metres (+6.0% for the twelfth consecutive quarter) compared with 2016.Recorded in all sectors, the increase is attributable to higher consumption of the thermoelectric sector (+1.93 billion cubic metres, +8.2%), driven by a particularly strong summer demand, by the reduction of hydroelectricity production due to water scarcity and by the continued shutdown of some French nuclear plants in the first two months of the year, the industrial sector (+1.22 billion cubic metres, +7.3%) thanks to the recovery in industrial, residential and tertiary production (+0.62 billion cubic metres, +2.1%) attributable to climate trends.
Gas demand by sector (% of total gas demand)
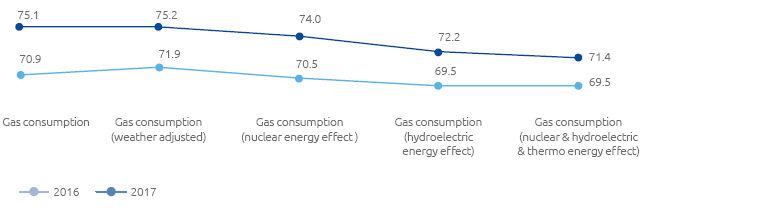
Adjusted for the weather effect, gas demand has been estimated as equal to 75.2 billion cubic metres, increasing by 3.3 billion cubic metres (+4.6%) compared to the corresponding value for 2016 (71.9 billion cubic metres). Starting from October 2016 and continuing into the first two months of 2017, the normalised demand for gas, not only in terms of the temperature, but also normalised for effects caused by the reduction of hydroelectric production and the unavailability of the French nuclear power, was estimated at 71.4 billion cubic metres, an increase of 1.9 billion cubic metres (or 2.7%) compared to the corresponding value for 2016 (69.5 billion cubic metres).
Normalised gas demand (billions of m3)
| Download XLS (17 kB) |
(billions of m3) |
2015 |
2016 (*) |
2017 |
Change |
Change % |
||||
|
|||||||||
Gas injected into the network by entry point |
60.82 |
65.07 |
69.35 |
4.28 |
6.6 |
||||
Domestic output |
6.43 |
5.57 |
5.24 |
(0.33) |
(5.9) |
||||
Total gas injected into the network |
67.25 |
70.64 |
74.59 |
3.95 |
5.6 |
||||
Net balance of withdrawals from/injections into storage (**) |
(0.31) |
(0.20) |
0.22 |
0.42 |
|
||||
Total availability of natural gas |
66.94 |
70.44 |
74.81 |
4.37 |
6.2 |
||||
The availability of natural gas in Italy (74.81 billion cubic metres) is equal to the sum of the gas injected into the National Transportation Network and the net balance of withdrawals from and injections into the storage system, and has increased by 4.37 billion cubic metres (+6.2%) when compared to 2016.This increase has been due to higher volumes of gas injected into the network at entry points (+3.95 billion cubic metres; +5.6%) and higher net withdrawals from the storage system (+0.42 billion cubic metres), the effects of which were partially offset by lower national production levels (-0.33 billion cubic metres; -5.9%).
| Download XLS (18 kB) |
(billions of m3) |
2015 |
2016 (*) |
2017 |
Change |
Change % |
||||
|
|||||||||
Domestic output |
6.43 |
5.57 |
5.24 |
(0.33) |
(5.9) |
||||
Entry points (**) |
60.82 |
65.07 |
69.35 |
4.28 |
6.6 |
||||
Tarvisio |
29.92 |
28.27 |
30.18 |
1.91 |
6.8 |
||||
Mazara del Vallo |
7.24 |
18.87 |
18.88 |
0.01 |
0.1 |
||||
Gries Pass |
10.63 |
6.70 |
7.25 |
0.55 |
8.2 |
||||
Gela |
7.11 |
4.81 |
4.64 |
(0.17) |
(3.5) |
||||
Cavarzere (LNG) |
5.80 |
5.72 |
6.85 |
1.13 |
19.8 |
||||
Panigaglia (LNG) |
0.05 |
0.22 |
0.62 |
0.40 |
|
||||
Livorno (LNG) |
0.04 |
0.48 |
0.91 |
0.43 |
89.6 |
||||
Gorizia |
0.03 |
|
0.02 |
0.02 |
|
||||
|
67.25 |
70.64 |
74.59 |
3.95 |
5.6 |
||||