Operating review
Technical investments
Technical investments totalling € 1,034 million (€ 906 million in 2016) referred mainly to the natural gas transportation (€ 917 million) and storage (€ 101 million) business segments.
Infrastructure development and integration
The main investments for the development of new infrastructure mainly involved work for the reversal of physical transportation flows at interconnection points with northern Europe (€ 249 million), the upgrade of the transportation network from entry points in southern Italy (€ 20 million) and the upgrade of the network and connection of new regional and national redelivery points (€ 107 million).A total of € 31 million was invested in 2017 for the development of new storage fields and upgrading capacity. With regard to completed works and disposals, as well as the acquisition of a 100% stake in Infrastrutture Trasporto Gas, a company that owns the pipeline connecting the Adriatic LNG regasification terminal to the national transport network at the height of Minerbio, the network of gas pipelines in operation saw an increase of 76 km compared to 31 December 2016) while the installed power in the compression plants amounted to 922.2 Megawatts (unchanged compared to 2016).Available storage capacity rose by 0.2 billion cubic metres, made available by the new Bordolano deposit, to a level of 12.2 billion cubic metres.
Maintenance of plant security and quality
Investments in projects aimed at maintaining plant security and quality totalled € 432 million for transportation and € 70 million for storage.
Throughout the year, the plants in the network are monitored 24 hours a day. With the help of simulation and optimisation programmes, their best asset is guaranteed with the aim of reducing the consumption of gas boosting fuels and thus containing the level of emissions.
The section of lines is inspected regularly by vehicles, using helicopters and personnel on foot in order to detect potentially hazardous situations caused, for example, by the works of third parties in the area of the pipelines. Geological inspections of pipeline sections are also carried out to identify potential instabilities along their routes. Similarly, any land slippage at specific points of the route is also kept under surveillance using suitable sophisticated equipment. The integrity of the pipelines is also inspected by passing devices along them known as “smart pigs”, which can detect any faults.
In terms of storage, particular attention is paid to the safety plants and people. Regular maintenance and plant improvement interventions are performed on a continuous and targeted basis, in order to always apply the best available technologies.
| Download XLS (16 kB) |
|
2015 |
2016 |
2017 |
Network inspected using smart pigs (km) |
1,315 |
1,660 |
1,632 |
Network inspected by helicopter (km) |
16,330 |
16,218 |
16,274 |
Network subjected to geological inspection (km) |
2,300 |
1,478 |
4,080 |
Interconnected transportation-storage capacity and network utilisation
The average transportation capacity provided in 2017 was 364.2 million cubic metres/day on average, which was in line with 2016 (-0.8%), while transferred capacity totalled 258.8 million cubic metres/day on average. Network saturation11 was 71.0%, a decrease compared with 2016 (79.1%).
The number of active transport users in 2017 was 128, compared to 136 users active in 2016.During the year, 78 connection agreements were entered into for the creation of new delivery/redelivery points, including 13 biomethane points.
+3.95
billion cubic metres of gas injected into the network (+5.6%)
Overall storage capacity, including strategic storage, was 16.7 billion cubic metres at 31 December 2017, an increase of 0.2 billion cubic metres over 2016 following the Bordolano site’s gradual entry into service, of which 12.2 was available capacity that was fully transferred for the 2017-2018 thermal year (99.9%), and the remaining 4.5 billion cubic metres was for strategic storage.
There were 89 active storage customers (91 in 2016).
Business volume
+6.0%
increasing gas demand for the twelfth consecutive quarter
In 2016 a total of 74.59 billion cubic metres of gas was injected into the network, an increase of 3.95 billion cubic metres (+5.6%) compared with 2016.The increase is essentially attributable to the increased demand for gas in Italy (+4.23 billion cubic metres, +6.0%, up for the twelfth consecutive quarter) recorded in all sectors, respectively in the thermoelectric sector (+1.93 billion cubic metres, +8.2%), driven by a particularly strong summer demand, by the reduction in hydroelectric production and by the continuation of the shutdown of some French nuclear plants in the first two months of the year, industrial ( +1.22 billion cubic metres, +7.3%), and residential and tertiary (+0.62 billion cubic metres, +2.1%).
Volumes handled in storage in line with the previous year
The volumes of gas moved through the storage system in 2017 totalled 19.9 billion cubic metres, a substantially in line with the volumes handled in 2016 (-0.08 billion cubic metres; equal to -0.4%).The reduction is mainly attributable to lower injections for the replenishment of storage facilities (-0.16 billion cubic metres, -1.6%), to shipper behaviour in relation to the different market conditions, partly offset by higher disbursements ( +0.08 billion cubic metres, +0.8%) due to the climatic trend.
+0.42
billion cubic metres of regasified LNG
During 2017, 0.63 billion cubic metres of LNG were regasified at the Panigaglia (SP) LNG terminal (0.21 billion cubic metres in 2016; +0.42 billion cubic metres), of which 0.084 billion cubic metres within the integrated natural gas regasification and storage service12.In 2017, 15 landfills from methane tankers were performed (5 landfills in 2016), of which 2 were landfills in the context of the aforementioned integrated service.
Key operating figures
In conformity with IFRS 8 “Operating segments”, the operating segments were defined on the basis of the internal reporting used by the Company’s management for allocating resources to the different segments and for analysing the respective performances.
To this end it is noted that:(i) the company Infrastrutture Trasporto Gas, which entered the scope of consolidation as of October 2017, has been consolidated within the Transportation sector; (ii) the company Snam 4 Mobility, which entered the scope of consolidation as of November 2017, has been consolidated within the Corporate and Other Activities sector.
| Download XLS (20 kB) |
|
2015 |
2016 |
2017 |
Change |
Change % |
||||||||||||
|
|||||||||||||||||
Natural gas transportation (a) |
|
|
|
|
|
||||||||||||
Natural gas injected into the National Gas Transportation Network (billions of cubic metres) (b) |
67.25 |
70.64 |
74.59 |
3.95 |
5.6 |
||||||||||||
Transportation network (kilometres in use) (c) |
32,534 |
32,508 |
32,584 |
76 |
0.2 |
||||||||||||
Installed power in the compression stations (MW) |
876.5 |
922.2 |
922.2 |
|
|
||||||||||||
Liquefied Natural Gas (LNG) regasification (a) |
|
|
|
|
|
||||||||||||
LNG regasification (billions of cubic metres) |
0.03 |
0.21 |
0.63 |
0.42 |
|
||||||||||||
Natural gas storage (a) |
|
|
|
|
|
||||||||||||
Available storage capacity (billions of cubic metres) (d) |
11.5 |
12.0 |
12.2 |
0.2 |
1.7 |
||||||||||||
Natural gas moved through the storage system (billions of cubic metres) |
19.58 |
20.00 |
19.92 |
(0.08) |
(0.4) |
||||||||||||
Employees in service at period end (number) (e) (f) |
3,005 |
2,883 |
2,919 |
36 |
1.2 |
||||||||||||
by business segment: |
|
|
|
|
|
||||||||||||
- Transportation |
1,918 |
1,726 |
1,972 |
246 |
14.3 |
||||||||||||
- Regasification |
73 |
71 |
63 |
(8) |
(11.3) |
||||||||||||
- Storage |
299 |
301 |
60 |
(241) |
(80.1) |
||||||||||||
- Corporate and other activities |
715 |
785 |
824 |
39 |
5.0 |
||||||||||||
The number of employees in service at 31 December 2017 was n. 2,919 (n. 2,883 employees at 31 December 2016), an increase of 36 (+1.2%) over the previous year. The average number of payroll employees for entities included in the scope of consolidation at 31 December 2017 was n. 2,880 (n. 2,804 employees in 2016).
On the one side 2017 featured significant organisational changes also related to the demerger of the distribution business segment and, on the other side, the development of the employment mix, which recorded the following dynamics over the course of the year:
- 184 employees joining, of which 148 were recruited from the market, and 36 others joining, including 27 due to the change in the consolidation of the company Infrastrutture Trasporto Gas in October 2017, 1 from non-consolidated companies and 8 returning from leave;
- 148 employees left the company, including 33 as a result of the termination of employment, 36 were terminated unilaterally, 73 transfers to non-consolidated companies and 6 other departures.
With respect to the Group’s national distribution, 2,204 people are employed in the northern regions of Italy, 202 in the central regions and 509 in the south. Furthermore, 4 individuals are permanently employed abroad.
Industrial relations
In 2017, the relationship with the trade unions at national and local level was characterised by numerous meetings (119).The activities concerned the analysis of the business development projects and new organisational structures, following the sale of the “Plants and Technical Services” business unit from Stogit S.p.A. to Snam Rete Gas S.p.A., carried out within the Integra project which provides for the integration of the transversal activities of the operating companies in order to develop and enhance specific skills.
Among the transport activities, the technical commission of the SMART GAS project continued its work on a more rational planning of the intervention agenda, with the objective of analysing the technical aspects of the project.
In the regasification area, meetings were held with the trade unions, at national and local level, aimed at sharing and comparing the issues concerning the evolution of the business.
The negotiation dynamics, consistent with the provisions of the Protocol on Industrial Relations of 17 October 2013 (based on the strengthening of second-level bargaining), have led the Parties to define the productivity and profitability indicators of the Participation Premium for 2017 for all the companies of Snam.
At the beginning of the year, the national employment contract applied in the Group was renewed.
In addition, all the companies of the Snam Group have signed the implementation agreement pursuant to Article 4 of Italian Law No. 92/2012 (the so-called “Fornero Law”), for an early exit of workers who meet the requirements set out therein.
Supply chain management
Snam adopts an ‘extended’ management model that, going beyond the boundaries of its company perimeter, involves and takes on the responsibility of supply chain operators (suppliers and subcontractors): everyone is encouraged to achieve increasingly sustainable performance in terms of risk mitigation, innovation of management processes, increase in operational efficiency and promotion of responsible governance procedures.
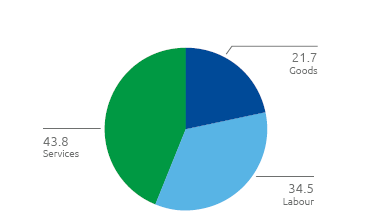
In 2016 Snam directly provided work for around 574 companies, 416 of which belong to the small-medium business sector (SME), concluding over 800 procurement contracts worth a total of approximately € 844 million. Among the goods purchased the most important material is steel (piping, connectors, etc.) which, in 2017, amounted to a supply of approximately 14,300 tonnes.
The change in the amount of procurement over the previous year must take into account the cyclical nature of the procurement process, in particular the fact that the 2017 purchase plan was also covered by multi-year contracts already stipulated in previous years.
More than 92% of the procurement concerns national companies (distributed in all Italian regions in line with the territorial belonging of each company), and about 7% concern Europe.
In order to guarantee the adequacy of the supply chain with respect to the supply requirements, in 2017 Snam conducted an intense market intelligence activity on about thirty different product categories connected to the core business and new activities (construction of new natural gas compression and storage stations for motor vehicles). The number of spontaneous applications received by aspiring suppliers was around 1,900.
At 31 December, the vendor list included 1,612 qualified suppliers, and 403 suppliers were in the process of being renewed or obtaining new qualifications. Snam exercises control of its supply chain by monitoring supplier performance during the execution phase of contracts through audits, inspections and evaluation processes. During the year, 854 feedback reports were collected on the services rendered by 156 suppliers. Additionally, 1,647 suppliers and sub-contractors were checked with regard to the regularity of contributions, through 3,739 inspections which led to the interception of 3% of irregularities.
With regard to the fight against corruption, all suppliers and subcontractors are required to accept the Integrity Ethics Pact and are subject to reputational checks. A total of 1,810 reputational checks were performed in 2017.
In the procurement of works, which is the most important category because it is related to core activities, the suppliers considered critical (critical levels A and B) were all in possession of quality and environment management systems certified with ISO 9001, ISO 14001 and ISO 18001 standards. In 2017 an objective was set to have at least 65% of the suppliers of goods (critical level A) who possess environmental management systems certified according to ISO 14001.
| Download XLS (16 kB) |
|
2015 |
2016 |
2017 |
2015-2017 |
Procured value |
1,266 |
1,359 |
844 |
3,469 |
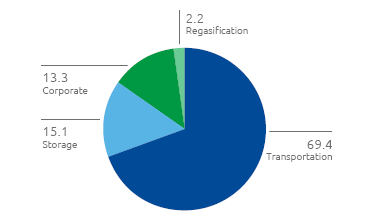
Procurement by region and merchandise category (*)
Geographical breakdown procurement in Italy (%)

Procurement by product category (%)
Breakdown of procurement by business segment (%)
Accidents
Snam is constantly committed to developing and promoting the protection of health and safety in the workplace. Research and adoption of good business practices are the subject of progressive promotion not only in the corporate area but also towards suppliers, with the aim of extending and improving collaboration on achieving the best performances.
In 2017 there were a total of 11 accidents (9 in 2016), of which 6 occurred to employees (4 in 2016) and 5 to contracting suppliers (5 in 2016); unfortunately, one accident had a fatal outcome.
| Download XLS (15 kB) |
|
2015 |
2016 |
2017 |
Total employee accidents |
3 |
4 |
6 |
Total contract worker accidents |
8 |
5 |
5 |
| Download XLS (17 kB) |
|
2015 |
2016 |
2017 |
||||
|
|||||||
Employees and contract workers |
|
|
|
||||
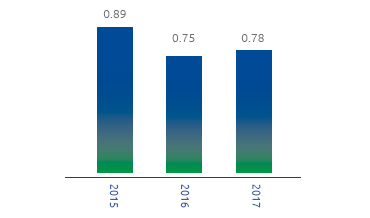
Frequency index |
0.89 |
0.75 |
0.78 |
||||
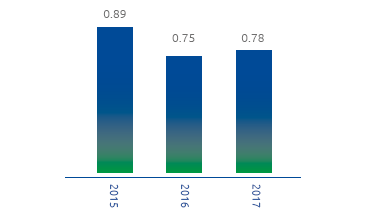
Severity index |
0.66 |
0.05 |
0.56 |
||||
Employees |
|
|
|
||||
Frequency index |
0.62 |
0.81 |
1.24 |
||||
Severity index |
1.55 |
0.04 |
0.05 |
||||
Contract workers |
|
|
|
||||
Frequency index |
1.07 |
0.71 |
0.54 |
||||
Severity index |
0.07 |
0.05 |
0.83 |
||||
Employee and contract worker accident graphs
Employee and Contractor accidents at work - frequency index (*)
Employee and contractor accidents at work - severity index (**)
Energy consumption
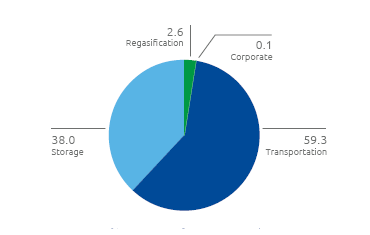
Snam’s main energy consumption is attributable to gas turbines used in compression plants that provide the pressure needed to transport gas (boost consumption) and storage concessions (storage consumption), which globally represent 88% of total consumption.
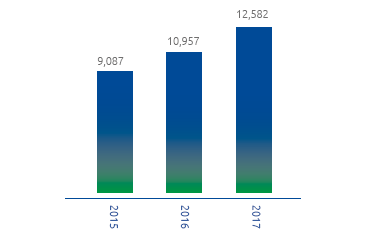
In 2017 energy consumption totalled around 12,582 terajoules (TJ), an increase of +14.8% over 2016.This increase is mainly due to the greater quantity of gas injected into the network (+5.6% compared to 2016) and to a different structure of the network for gas calculation management, from daily to hourly.
Natural gas accounted for 96.6% of the energy needs. Other sources used are electricity (2.7%) and other fuels (diesel fuel, gasoline, LPG and heat), which together are equivalent to 0.7%.
Energy consumption data
Energy consumption (TJ)
Energy Consumption by activity (%)
Greenhouse gas emissions
Direct emissions of CO2 eq – Scope 1 (103 t) (*)
Total direct GHG emissions scope 1 (kt CO2 eq)
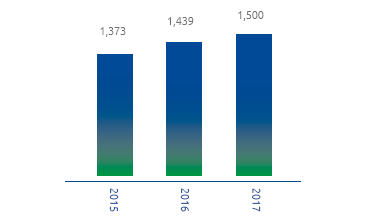
In 2016 direct CO2eq emissions were equal to approximately 1.50 million tonnes (+4.3% compared to 2016). Direct CO2 emissions from combustion were equal to approximately 0.69 million tonnes (+14.4% compared to 2016), while CO2eq emissions from methane stood at approximately 0.81 million tonnes. In 2017, methane emissions per kilometre of transport network were reduced by 1.5% compared to 2016.
1 January 2013 was the start of the third regulatory period (2013-2020) of the Emission Trading System (ETS), the greenhouse gas emission allowance system governed by Italian Legislative Decree30 of 13 March 2013, as amended, and transposing Directive 2009/29/EC.
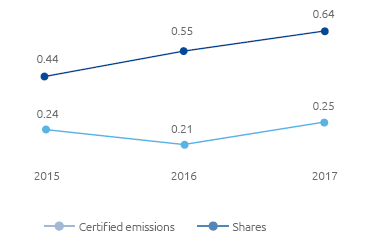
In 2017, the Snam Group’s total CO2 emissions from ETS plants, certified by an accredited body according to the provisions of the competent national authority, amounted to approximately 0.64 million tonnes, out of total annual allowances of approximately 0.252 million issued by the Ministry for the Environment, Land and Sea (negative balance of 0.39 million allowances). This deficit is offset by the allowances already present in the registers for Snam Group plants, accumulated thanks to the surplus from previous years.
| Download XLS (16 kB) |
Business |
Number of plants |
Name of plants |
Transportation |
11 |
Gas compression stations in Enna, Gallese, Istrana, Malborghetto, Masera, Melizzano, Messina, Montesano, Poggio Renatico, Tarsia, Terranuova Bracciolini |
Storage |
8 |
Storage gas compression stations in Cortemaggiore, Fiume Treste, Minerbio, Ripalta, Sabbioncello, Sergnano, Settala and Bordolano |
Regasification |
1 |
Liquefied natural gas plant in Panigaglia |
CO2 emissions from ETS plants
CO2 emissions ETS plants (106 t)
11 Ratio of capacity transferred to available capacity.
12 The convertible bond loan with a nominal value of € 400 million is not part of the EMTN Programme.