Operating review
Gas moved through the storage system
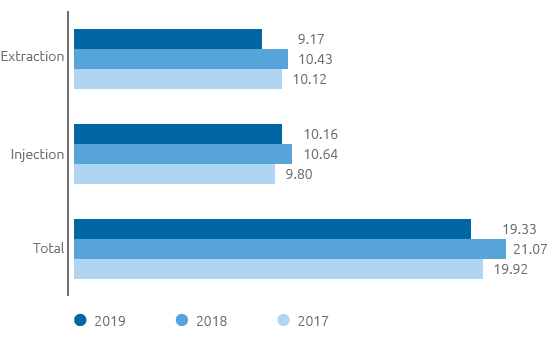
Volumes of gas moved through the storage system in 2019 amounted to 19.33 billion cubic metres, a fall of 1.74 billion cubic metres, or 8.3%, compared with 2018.
The reduction was mainly attributable to lower withdrawals from storage (-1.26 billion cubic metres; -12.1%), mainly as a result of weather conditions.
Natural gas moved through the storage system (billions of cubic metres)
| Download XLS (20 kB) |
|
2017 |
2018 |
2019 |
|---|---|---|---|
Active customers (shippers) |
89 |
91 |
90 |
In 2018 the Company implemented a digital platform (Jarvis) aimed at improving commercial operations.
The Jarvis platform, which actively involves customers, is designed to adopt a process for the renewal of services and technologies to support all commercial transportation, storage and regasification processes based on the feedback received from customers and also proposes to promote the range of integrated services offered on the Italian market possibly also enabling services for the foreign market.
From the point of view of services, on 22 May 2019 Snam opened the new Jarvis commercial platform of integrated services to its customers, implemented in 2018 and developed in conjunction with market operators. More information with regard to the new services introduced in 2019 are given in the section “Provision and development of services - Transportation of natural gas” in this Report, also on the basis of the implementation and integrated management of the platform for all the regulated businesses in which Snam operates.
| Download XLS (20 kB) |
(%) |
2017 |
2018 |
2019 |
|---|---|---|---|
Contracted storage capacity/Available storage capacity |
99.9 |
99.7 |
100 |
Compliance with time frames for providing services subject to specific commercial quality standards |
100 |
100 |
100 |
Connection flow lines subject to supervision |
100 |
100 |
100 |
Total capacity not made available following interruptions/reductions to the service |
0 |
0 |
0 |
Organisational changes
At the end of 2019, the number of personnel in service totalled 61, essentially in line compared with 31 December 2018 (59).
Following the conclusion of the integration project, transportation-storage dispatching operations are managed through an integrated procedure.
Under the project for the rationalisation and simplification of the current Snam regulatory framework the process for issuing rules to simplify and standardise operating processes was completed, including the document for the management of the availability and traceability of operating personnel.
Lastly, the project for the activation of the centres dedicated to the well and deposits area was finalised in 2019.
Accidents
In 2019, there were no accidents involving either employees or contract workers.
| Download XLS (20 kB) |
|
2017 |
2018 |
2019 |
|---|---|---|---|
Total employee accidents |
2 |
0 |
0 |
Total contract worker accidents |
0 |
0 |
0 |
| Download XLS (21 kB) |
|
2017 |
2018 |
2019 |
||||
|---|---|---|---|---|---|---|---|
|
|||||||
Employees |
|
|
|
||||
Frequency index (*) |
6.71 |
0 |
0 |
||||
Severity index (**) |
0.43 |
0 |
0 |
||||
Contract workers |
|
|
|
||||
Frequency index (*) |
0 |
0 |
0 |
||||
Severity index (**) |
0 |
0 |
0 |
||||
Energy consumption and emissions
The company, in accordance with its sustainable growth model, updated and set new voluntary targets, valid objectives for all Snam businesses (transportation, storage, regasification):
- to reduce its natural gas emissions by 2022 and 2025, respectively by 15% an 40%, excluding emergencies, compared with the 2016 figures;
- to reduce its scope 1 and scope 2 emissions by 2030 by 40%, excluding emergencies, compared with the 2016 figures;
- to increase the ratio between green electricity bought and the total to reach 55% by 2030.
In 2019 energy consumption for gas storage fell by 10% compared with 2018, also thanks to the reduction in gas injected into the deposits (-4.5%). In 2019, nitrogen oxide emissions totalled around 116 tonnes (-51% compared with 2018). This decrease is mainly attributable to the reduction in consumption and use of DLE dry low emission turbines. Specifically, with the DLE turbine coming into operation in 2019 in the Minerbio storage plant as well, all the storage sites were operating with low emission units for 100% of operating hours.
| Download XLS (21 kB) |
|
2017 |
2018 |
2019 |
||
|---|---|---|---|---|---|
|
|||||
Energy consumption (TJ) |
4,787 |
5,337 |
4,784 |
||
Emissions of CO2eq – scope1 (t) (*) |
447,662 |
473,206 |
423,630 |
||
Emissions of natural gas (106 m3) |
10.7 |
10.5 |
9.2 |
||
NOx emissions (t) |
175 |
236 |
115.9 |
||