Operating review
Technical investments
Technical investments totalled €963 million (€882 million in 2018) and referred mainly to the natural gas transportation (€813 million) and storage (€112 million) business segments).
Infrastructure development and integration
The main investments for the development of new infrastructure mainly involved work for the of reversal of physical transportation flows at interconnection points with northern Europe (€32 million), the upgrade of the transportation network from entry points in southern Italy through, specifically, the interconnection with TAP (€95 million) and the upgrade of the network and connection of new regional and national redelivery points (€107 million). A total of €35 million was invested in 2019 for the development of new storage fields and upgrading capacity.
As a result of the work completed and disposals carried out during the year, the pipeline network in operation grew by a total of 102 km compared with 31 December 2018), while the installed capacity in compression stations stood at 961 megawatts, in line with the previous year. Available storage capacity rose by 0.1 billion cubic metres, made available by the gradual entry into operation of the new Bordolano deposit, to a level of 12.5 billion cubic metres.
Maintenance of plant security and quality
Investments in projects aimed at maintaining plant security and quality totalled €424 million for transportation and €60 million for storage.
Throughout the year, the plants in the network are monitored 24 hours a day. With the help of simulation and optimisation programmes, their best asset is guaranteed with the aim of reducing the consumption of gas boosting fuels and thus containing the level of emissions.
The pipeline layout is then inspected regularly on foot, by vehicle, and using helicopters to detect potentially hazardous situations caused, for example, by the works of third parties in proximity to the pipelines. Geological inspections of the pipeline section are also carried out to identify potential instabilities along the sections. Similarly, any land slippage at specific points along the route is also kept under surveillance, using appropriate sophisticated equipment, if needed. Pipeline integrity is also monitored by passing a smart pig inside them to detect of any material defects or anomalies.
| Download XLS (21 kB) |
(km) |
2017 |
2018 |
2019 |
|---|---|---|---|
Network inspected using smart pigs |
1,632 |
1,651 |
1,651 |
Network inspected by helicopter |
16,274 |
18,462 |
20,178 |
Network subjected to geological inspection |
4,080 |
4,209 |
5,163 |
The security of storage plants is guaranteed by various detection systems connected to automatic security systems: explosive mixture detectors, fire detectors, smoke detectors, high or low pressure switches, pressure transmitters, fuse plug systems and heat sensitive cables, sound-level meters for detecting gas leaks and extinguisher systems. The intervention of these systems activates the security systems of the plants, monitored 24/7 by the San Donato Milanese dispatch service.
All pressure vessels and lines are periodically checked by outside bodies, while the connecting flow lines between the compression and treatment systems and the clusters are monitored through the regular inspection of the section, carried out on foot or in vehicles. Periodically, a smart device fitted with sensors is passed inside these ducts, a so-called smart pig, that makes it possible to detect the presence of any defects or irregularities in the material and even the slightest movement of the duct. In addition, microseismic monitoring is taking place, offering guarantees on the secure management of storage activities and the monitoring of soil movements with data from an interferometric satellite SAR and continuous acquisitions in real time obtained through CGPS stations.
Interconnected transportation-storage capacity and network utilisation
The average transportation capacity provided in 2019 was 362.9 million cubic metres/day on average, which was in line with 2018 (+0.6%), while transferred capacity totalled 231.4 million cubic metres/day on average. Network saturation7 was 63.8%, a decrease compared with 2018 (79.5%).
The number of active transport users in 2019 was 150, compared with 136 active users in 2018. During the year, 123 connection agreements were entered into for the creation of new delivery/redelivery points, including 26 for the injection of biomethane and 61 relating to CNG service areas.
Overall storage capacity, including strategic storage, was 17.0 billion cubic metres at 31 December 2019, an increase of 0.1 billion cubic metres over 2018 following the Bordolano site’s gradual entry into service, of which 12.5 was available capacity that was fully transferred for the 2019-2020 thermal year and the remaining 4.5 billion cubic metres was for strategic storage.
There were 90 active storage customers (91 in 2018).

Business volumes
In 2019 a total of 75.37 billion cubic metres of gas was injected into the network, an increase of 2.55 billion cubic metres (+3.5%) compared with 2018. The increase was mainly as a result of higher consumption in the thermoelectric power generation sector (+2.45 billion cubic metres; +10.1%) following greater use of natural gas in the generation of electricity, the reduction in electricity imports and the smaller production from renewable sources, particularly hydroelectric production, as well as the rise in wind and solar power.
75.37
Billion m3 of gas injected into the network (+3,5%)
The available storage capacity at 31 December 2019 of 12.5 billion cubic metres (+0.1 billion cubic metres compared with 2018, made available by the gradual entry into operation of the new Bordolano deposit), represents the greatest capacity offered at a European level, and was conferred in full for the 2019-2020 thermal year.
74.34
Billion m3 gas demand (+2.3%)
Volumes of gas moved through the storage system in 2019 amounted to 19.33 billion cubic metres, a fall of 1.74 billion cubic metres, or 8.3%, compared with 2018. The reduction was mainly attributable to lower withdrawals from storage (-1.26 billion cubic metres; -12.1%) mainly as a result of weather conditions.
100%
of available capacity conferred
During 2019, the Panigaglia (SP) LNG terminal regasified 2.40 billion cubic metres of LNG (0.91 billion cubic metres in 2018, +1.49 billion cubic metres). In 2019 57 methane tankers were unloaded (+36 compared with 2018).
57
methane tankers unloaded (+36 compared with 2018)
The significant increase in volumes of activities compared with last year, is mainly due to the greater competitiveness of the cost of LNG compared with natural gas, as well as the new regasification capacity allocation mechanisms through dedicated auctions.
Key operating figures
In conformity with IFRS 8 “Operating segments”, the operating segments were defined on the basis of the internal reporting used by the Company’s management for allocating resources to the different segments and for analysing the respective performances. For this purpose, the companies entering the scope of consolidation in 2019 were consolidated within the “Corporate and other activities” sector, with the exception of Enura, consolidated within the “Natural gas transportation” operating sector”.
| Download XLS (24 kB) |
|
2017 |
2018 |
2019 |
Change |
% change |
||||||||||
|---|---|---|---|---|---|---|---|---|---|---|---|---|---|---|---|
|
|||||||||||||||
Natural gas transportation (a) |
|
|
|
|
|
||||||||||
Natural gas injected into the National Gas Transportation Network (billions of cubic metres) (b) |
74.59 |
72.82 |
75.37 |
2.55 |
3.5 |
||||||||||
Transportation network (kilometres in use) |
32,584 |
32,625 |
32,727 |
102 |
0.3 |
||||||||||
Installed power in the compression stations (MW) |
902 |
961 |
961 |
|
|
||||||||||
Liquefied Natural Gas (LNG) regasification (a) |
|
|
|
|
|
||||||||||
LNG regasification (billions of cubic metres) |
0.63 |
0.91 |
2.40 |
1.49 |
|
||||||||||
Natural gas storage (a) |
|
|
|
|
|
||||||||||
Available storage capacity (billions of cubic metres) (c) |
12.2 |
12.4 |
12.5 |
0.1 |
0.8 |
||||||||||
Natural gas moved through the storage system (billions of cubic metres) |
19.92 |
21.07 |
19.33 |
(1.74) |
(8.3) |
||||||||||
Employees in service at the year-end (number) (d) |
2,919 |
3,016 |
3,025 |
9 |
0.3 |
||||||||||
by business segment: |
|
|
|
|
|
||||||||||
- Transportation |
1,972 |
1,915 |
1,945 |
30 |
1.6 |
||||||||||
- Regasification |
63 |
64 |
65 |
1 |
1.6 |
||||||||||
- Storage |
60 |
59 |
61 |
2 |
3.4 |
||||||||||
- Corporate and other activities (e) |
824 |
978 |
954 |
(24) |
(2.5) |
||||||||||
Personnel
The number of employees in service at 31 December 2019 was 3,025 (3,016 employees at 31 December 2018), an increase of 9 (+0.3%) over the previous year. The average number of payroll employees for entities included in the scope of consolidation at 31 December 2019 was 3,042 (2,949 employees in 2018).
The following dynamics were recorded during 2019:
- the entry of 231 resources, 172 of whom were recruited from the market, 59 others who entered as a result of the change in the scope of consolidation following the acquisition of TEA Servizi S.r.l. (8 resources) and the Renerwaste Group (47 resources in total with reference to Renerwaste S.r.l. and Renerwaste Lodi S.r.l.), and the return of 4 employees from leave;
- 222 employees left the company, including 68 as a result of the termination of employment, 45 were terminated unilaterally (including, among other things, resigning and being fired) and 77 took early retirement. In addition, there were another 12 exits going on leave and 12 transfers to non consolidated companies.
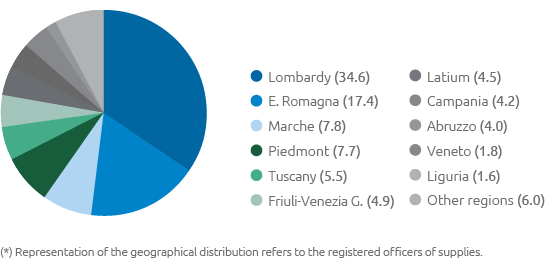
With respect to the Group’s distribution country-wide, 2,295 people are employed in the northern regions of Italy, 241 in the central regions and 477 in the south. Furthermore, 13 individuals are permanently employed abroad.
Industrial relations
In 2019 relations with trade unions nationally and locally featured numerous meetings dedicated to analysing business development projects and new organisational arrangements also following the acquisition of Cubogas.
As regards transportation and storage, the integration process resulting from the Integra project, which calls for integrating side activities of the operational companies to develop and exploit the specific skills, was followed.
For the transportation business, the Smart Gas technical committee’s work continued, seeking for a more rational scheduling of the operations with the objective of analysing the technical aspects of the project. In addition, a technical commission was launched for the Smart Gas System project designed to analyse the technical issues relating to this further organisational technical development.
For the regasification business, meetings were held with the Trade Unions, nationally and locally, in order to share and discuss topics intrinsic to the business evolution.
The bargaining dynamics, consistent with the provisions of the 2013 Industrial Relations Protocol, whose reasoning were imbued with the concept of strengthening second-level negotiations, led the Parties to define productivity and profitability indicators for the 2018 Participation Bonus for all Snam Group companies.
Furthermore, all the Snam Group companies signed the implementation agreement pursuant to the Article 4 of Law 92/2012 for an early exit of an additional 110 workers who meet the requirements prescribed by the law.
An electronic ticket was introduced at group level through a trade union agreement for all organisations operating in the area.
Supply chain management
Snam adopts an ‘extended’ management model that, going beyond the boundaries of its company perimeter, involves and takes on the responsibility of supply chain operators (suppliers and subcontractors): everyone is encouraged to achieve increasingly sustainable performance in terms of risk mitigation, innovation of management processes, increase in operational efficiency and promotion of responsible governance procedures.
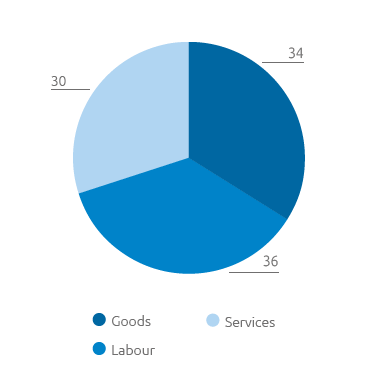
In 2019 Snam directly provided work for around 600 companies (+11% compared with 2018) 424 of which belong to the small-medium business sector (SME), concluding over 896 procurement contracts worth a total of approximately €1,550 million (+2% compared with 2018). Among the goods purchased the most important material is steel (piping, connectors, etc.) which, in 2019, amounted to a supply of approximately 86,000 tonnes.
| Download XLS (20 kB) |
(millions of €) |
2017 |
2018 |
2019 |
2017-2019 |
|---|---|---|---|---|
Amount of purchases |
844 |
1,520 |
1,550 |
3,914 |
Around 1,300 million procured involve Italy (distributed in all Italian regions in line with the Company’s strong roots in the area), while as far as activities abroad are concerned, in 2019 Snam signed 23 contracts, worth a total of more than €3 million, and continued exporting its know-how, especially in England, for the management of gas turbines, and in China for the management and maintenance of gas storage facilities.
To guarantee the adequacy of suppliers in relation to procurement requirements, Snam is constantly conducting intense market intelligence activities and scouting activities for new suppliers: in 2019 around 260 companies were contacted, relating to about 70 different product categories and the classification of 110 new candidates was begun. The number of spontaneous applications received from prospective suppliers was 980. This activity is particularly important to support Snam’s strategy to energy transition expanding the pool of suppliers for product categories involving the new businesses (biomethane, hydrogen, CNG, SSLNG).
At 31 December 2019, the vendor list included 2,085 qualified suppliers, and 722 suppliers were in the process of being renewed or obtaining new qualifications. Snam exercises control of its supply chain by monitoring supplier performance during the execution phase of contracts through audits, inspections and evaluation processes. During the year, 937 feedback reports were collected (+14% compared with 2018) on the services rendered by 117 suppliers. Additionally, 1,913 suppliers and sub-contractors were checked with regard to the regularity of contributions, through 3,959 inspections which led to the interception of 2.25% of irregularities.
With regard to the fight against corruption, all suppliers and subcontractors are required to accept the Integrity Ethics Pact and are subject to reputational checks. In 2019 2,490 reputational checks were conducted on suppliers and contractors.
In the procurement of works, which is the most important category because it is related to core activities, the suppliers considered critical (critical levels A and B) were all in possession of quality and environment management systems certified with ISO 9001, ISO 14001 and ISO 18001 standards.
To evaluate their performance, Snam uses a rating index (IR) that takes into consideration compliance with technical contractual requirements (Quality), health-safety-environment (HSE), agreed delivery times (Level of service), establishing a good relationship with the customer for the entire duration of the contract (Behaviour). The assessment is periodically forwarded to suppliers in the form of an analytical opinion.
Snam may restrict, suspend or even revoke the qualification of a supplier who fails to meet the agreed standards. The possible cases could include, failing to meet technical-organisational requirements, negative performance evaluation for it or its subcontractors, non-compliance with the provisions relating to contributory regularity and the rules in the Snam Code of Ethics. In 2019 41 provisions were issued in this area (+17% compared with 2018).
Geographic breakdown of procurement in Italy (%) (*)
In 2019 as far as IES Biogas, TEP Energy Solutions and CUBOGAS were concerned a total of 1012 suppliers were qualified, 918 of which with at least one contract and 891 which can be qualified as small and medium-sized businesses (SMEs) making a total of 1,031 contracts issued.
The total procurement was €108.8 million with 96.3% procured in Italy.
Procurement by goods type
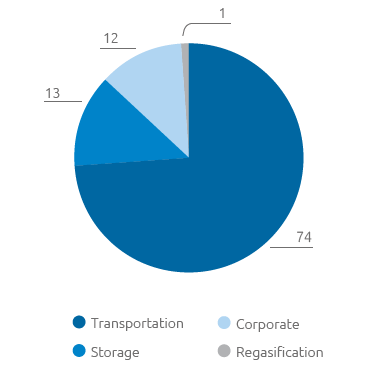
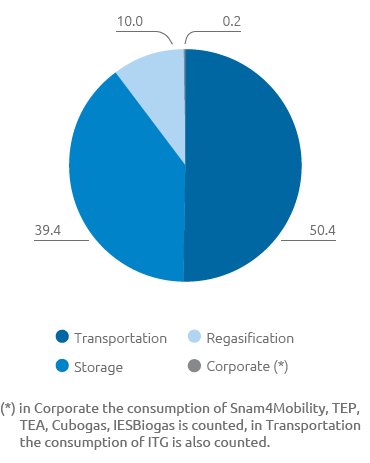
Procurement by business segment
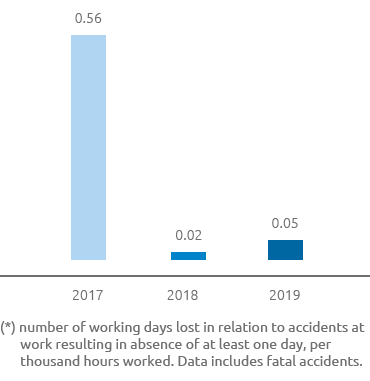
Accidents
Snam is constantly committed to developing and promoting health and safety in the workplace. Research into and the adoption of good business practices is subject to gradual promotion not only within the company, but also vis-à-vis suppliers, to extend and improve collaboration so as to achieve the best performance.
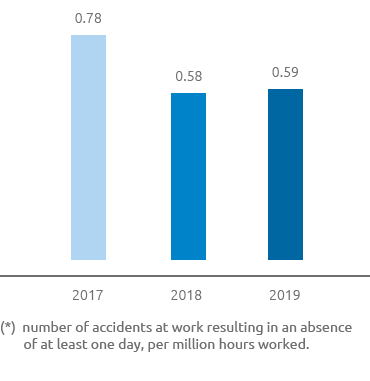
In 2019 a total of 7 accidents took place (the same as in 2018) 2 of which involved Snam Group employees (4 in 2018), both of which were in companies acquired last year (IES-Biogas and Cubogas) and 5 involved suppliers/contractors (3 in 2018).
| Download XLS (19 kB) |
(no.) |
2017 |
2018 |
2019 |
|---|---|---|---|
Total employee accidents |
6 |
4 |
2 |
Total contract worker accidents |
5 |
3 |
5 |
| Download XLS (21 kB) |
|
2017 |
2018 |
2019 |
||||
|---|---|---|---|---|---|---|---|
|
|||||||
Employees and contract workers |
|
|
|
||||
Frequency index |
0.78 |
0.58 |
0.59 |
||||
Severity index |
0.56 |
0.02 |
0.05 |
||||
Employees |
|
|
|
||||
Frequency index |
1.24 |
0.84 |
0.41 |
||||
Severity index |
0.05 |
0.02 |
0.03 |
||||
Contract workers |
|
|
|
||||
Frequency index |
0.54 |
0.41 |
0.71 |
||||
Severity index |
0.83 |
0.03 |
0.07 |
||||
Accidents at work - Employee and contract worker frequency index (*)
Accidents at work - Employee and contract worker severity index (*)
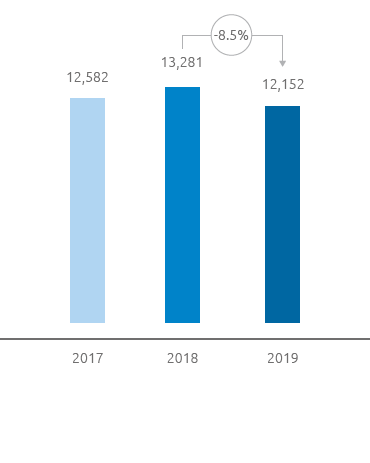
Energy consumption
Snam’s main energy consumption is attributable to the gas turbines used in the compression plants which provide the pressure necessary for transporting the gas (thrust consumption) and in the storage facilities (storage consumption) which, globally, represents 81% of total consumption, down compared with 2018 (88%) as a result of the increase in the energy consumption of the LNG Italia regasification facility which represented 10% of the Group’s total consumption (3.5% in 2018). The increase is in line with the increase in the quantity of regasified gas (+170%). In 2019 total energy consumption stood at around 12,152 TJ (-8,5% compared with 2018) in spite of an overall increase in the gas injected into the network (+3.5%). This result was promoted by the difference provenance of the gas from import points (less use of the back-up network from north Africa more energy-intensive than the other ones). In addition to natural gas, the other energy sources are electricity (3.5%) and other fuels (diesel fuel, gasoline, LPG and heat), which together amount to 0.8% of the total consumption. The Company, which is committed to combating climate change, has declared that it will use 55% green electricity by 2030.
Energy consumption by business segment (%)
Energy consumption (TJ)
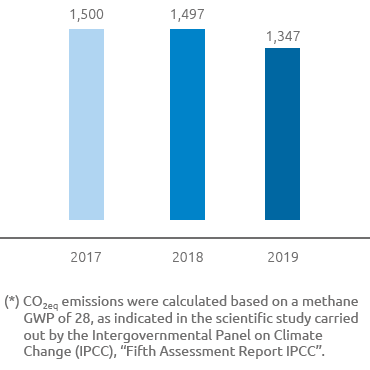
Greenhouse gas emissions
In 2019 direct CO2eq emissions amounted to approximately 1.35 million tonnes (a distinct reduction of 10% compared with 2018).
The reduction in direct emissions is partly due to the reduction in energy consumption, assisted by the different provenance of gas from import points (less use of the back-up network from north Africa which is more energy-intensive compared with the other import lines), but especially as a result of the initiatives implemented to reduce natural gas emissions, a demonstration of the effectiveness of the decarbonisation strategy adopted by Snam at the time.
Specifically, in 2019 Snam reduced its emissions into the atmosphere thanks to the adoption of various initiatives:
- reduction of natural gas emissions (down by 11.5% compared with the 2018 value and 19% compared with 2016 thanks to the adoption of different best practices);
- the production of electricity from photovoltaic plants and the purchase of green electricity (the consumption of green electricity increased, going from 37% in 2018 to 44% in 2019);
- installation of plants with LED lighting replacing other lighting equipment with greater consumption;
- savings resulting from the renovation of buildings;
- smart working.
These actions made it possible for the company not to release around 182 thousand tonnes of CO2eq into the atmosphere, the maximum value in recent years, an increase of 17% compared with 2018 as a result of the company’s ever increasing commitment to combating climate change.
The CO2 emissions from combustion amounted to approx 0.656 million tonnes (-9.7% compared with 2018), whereas the CO2eq emissions deriving from the methane emissions amounted to approximately 0.69 million tonnes (-10.4% compared with 2018). Natural gas emissions stood at 39.2 million m³, down compared with 44.4 million m³ in 2018.
The Company, committed to tackling climate altering emissions, set new targets:.
- a 40% reduction by 2030 of all direct CO2eq emissions (Scope 1) and indirect (Scope 2), from base year 2016;
- a 40% reduction in natural gas emissions by 2025 from base year 2016 (target increased by 15 percentage points compared with last year).
In 2019 the emission into the atmosphere of 9.4 million cubic metres of natural gas was prevented, equal to around 165,000 tonnes of CO2eq (+16 % compared with the approximate figure of 142,000 tonnes of CO2eq in 2018). These performances were made possible by the on-line gas compression interventions and the interventions with tapping machines, technology that makes it possible to disconnect pipelines in operation for new connections without an interruption to the service.
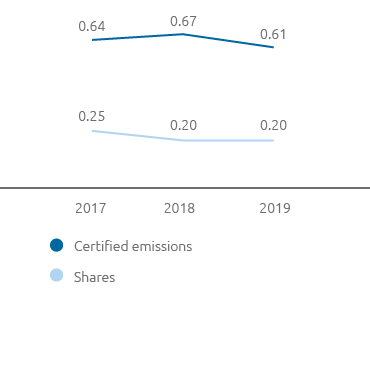
In 2019, carbon dioxide emissions of the Snam Group facilities covered by the ETS were overall greater than the emission permits allocated. In view of around 0.609 million tonnes of carbon dioxide emitted into the atmosphere, around 0.202 million tonnes were allocated free of charge, resulting in a 0.407 million tonne deficit. The allowances allocated also include those intended for the new entrants, the gas compression plants of Minerbio and Sergnano for 2018 and 2019. The allocation of free allowances by the competent national authority each year is gradually reduced each year as set out from the third regulatory period in Article 10 bis of Directive 2009/29/EC.
Total direct GHG emissions - Scope 1 (kt CO2eq) (*)
CO2 emissions from ETS plants (106 t)
| Download XLS (21 kB) |
Intangible |
No. of plants |
Plants' name |
|---|---|---|
Transportation |
13 |
Gas compression stations in Enna, Gallese, Istrana, Malborghetto, Masera, Melizzano, Messina, Montesano, Poggio Renatico, Tarsia, Terranuova Bracciolini, Minerbio, Segnano |
Storage |
8 |
Storage gas compression stations in Cortemaggiore, Fiume Treste, Minerbio, Ripalta, Sabbioncello, Sergnano, Settala and Bordolano |
Regasification |
1 |
Liquefied natural gas plant in Panigaglia |
7 Ratio of capacity transferred to available capacity.