Regasification of Liquefied Natural Gas (LNG)
The Panigaglia plant, built in 1971 and owned by GNL Italia, is able to regasify 17,500 cubic metres of LNG every day; under conditions of maximum efficiency, it can supply more than 3.5 billion cubic metres of natural gas into the transport network every year. Total gas regasified at the Panigaglia plant in 2018 came to 0.91 billion m3 (0.63 billion m3 in 2017; +44.4%).
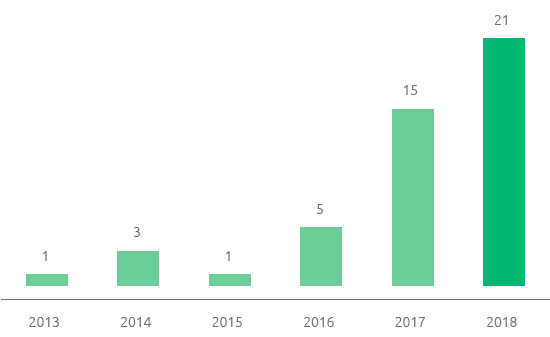
In 2018, 21 methane tanker loads were unloaded (15 in 2017; +40%).
Methane tanker trend
The regasification service includes unloading the LNG from the vessel, operating storage for the time required for vaporising the LNG, regasifying it and injecting it into the national network at the Panigaglia entry point. Moreover, starting October 2018, GNL Italia has made a service available to terminal users, called the “Flexibility service”, which enables the user so requesting to alter its daily delivery profile.
The regasification service can be continual for the entire thermal year or work on a spot basis and starting October 2018, the regasification capacity is conferred by means of suitable auction procedures; it also includes the auxiliary service, which consists of correcting the calorific power of natural gas to respect the quality specifications required for its release to the transmission network (correction of the Wobbe index).
The new capacity allocation mechanisms through auction, as well as the new businesses in the sector of SSLNG linked, in particular, to possible future uses in heavy good transport and shipping, lead us to hypothesise further growth in LNG consumption over the next few years.
In 2018, GNL Italia supplied 2 active clients (4 in 2017) with the regasification service.
Daily regasification capacity
maximum of LNG of the plant in
Panigaglia
Maximum annual quantity
of natural gas that can be
released into the network for
transmission
(+44.4%)
Quantity of LNG regasified in
2018 in Panigaglia
Methane tanker loads
| Download XLS (19 kB) |
(€ million) |
2016 |
2017 |
2018 |
Var. ass. |
Var. % |
||||||||
|
|||||||||||||
Total revenue (a) |
19 |
22 |
24 |
2 |
9.1 |
||||||||
- of which regulated revenue (a) |
18 |
21 |
20 |
(1) |
(4.8) |
||||||||
Total revenue net of pass-through items (a) |
19 |
19 |
21 |
2 |
10.5 |
||||||||
Operating costs (a) |
12 |
15 |
17 |
2 |
13.3 |
||||||||
Operating costs net of pass-through items (a) |
12 |
12 |
14 |
2 |
16.7 |
||||||||
EBIT |
(5) |
2 |
2 |
|
|
||||||||
|
|
|
|
|
|
||||||||
Technical investments (b) |
7 |
5 |
9 |
4 |
80.0 |
||||||||
Net invested capital at 31 December |
93 |
89 |
86 |
(3) |
(3.4) |
||||||||
Volumes of regasified LNG (billions of cubic metres) (c) (d) |
0.21 |
0.63 |
0.90 |
0.27 |
42.9 |
||||||||
Tanker loads (number) |
5 |
15 |
21 |
6 |
40.0 |
||||||||
Employees in service at 31 December (number) |
71 |
63 |
64 |
1 |
1.6 |
||||||||