Injections into and withdrawals from the transportation network
In 2018, a total of 72.82 billion cubic metres of gas was injected into the network, a decrease of 1.77 billion cubic metres (-2.4%) compared with 2017.
Injections into the network from domestic production fields or collection and treatment centres totalled 5.12 billion cubic metres, down by 0.12 billion cubic metres (-2.3%) compared to 2017.
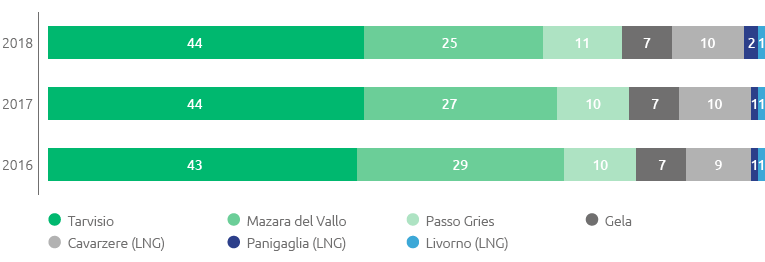
The volumes injected at entry points connected with other countries and with regasification plants, equalled 67.70 billion cubic metres overall, a drop of 1.35 billion cubic metres (+ -2.4%) compared to 2017.
This change is due to the reduction in the volumes of gas injected at the Mazara del Vallo entry point (-1.79 billion cubic metres; -9.5%), the Tarvisio entry point (-0.49 billion cubic metres; -1.6%) and Gela (-0.17 billion cubic metres; -3.7%), the effects of which were partly offset by higher volumes injected at the entry points of Passo Gries (+0.51 billion cubic metres; +7.0%) and the LNG regasification terminals (+0.28 billion cubic metres; +3.3%).
Natural gas injected into the network by import point
(% of total gas injected)
| Download XLS (17 kB) |
(billions of m3) |
2016 |
2017 |
2018 |
Change |
% change |
||||
|
|||||||||
Redelivery to the domestic market |
69.91 |
73.97 |
71.48 |
(2.49) |
(3.4) |
||||
Exports and transit (*) |
0.27 |
0.33 |
0.45 |
0.12 |
36.4 |
||||
Consumption and emissions attributable to Snam Rete Gas |
0.23 |
0.28 |
0.27 |
(0.01) |
(3.6) |
||||
Gas not accounted for and other changes (**) |
0.03 |
0.24 |
0.19 |
(0.05) |
(20.8) |
||||
Total withdrawals of natural gas |
70.44 |
74.82 |
72.39 |
(2.43) |
(3.2) |
||||
The natural gas withdrawn from the National Transportation Network in 2018 (72.39 billion cubic metres) is mainly: (i) redelivery to users at network exit points (71.48 billion cubic metres; -3.4%); (ii) exports and transit (0.45 billion cubic metres; +36.4%); and (iii) consumption by the compression plants and gas emissions from the network and from Snam Rete Gas plants (0.27 billion cubic metres; -3.6%).
| Download XLS (19 kB) |
(billions of m3) |
2016 |
2017 (a) |
2018 |
Change |
% change (b) |
||||||||||
|
|||||||||||||||
Total gas injected into the network |
70.64 |
74.59 |
72.82 |
(1.77) |
(2.4) |
||||||||||
Net balance of withdrawals from/injections into storage (c) |
(0.20) |
0.23 |
(0.43) |
(0.66) |
(287.0) |
||||||||||
Total withdrawals of natural gas |
70.44 |
74.82 |
72.39 |
(2.43) |
(3.2) |
||||||||||
Exports (-) (d) |
(0.27) |
(0.33) |
(0.45) |
(0.12) |
36.4 |
||||||||||
Gas injected into the regional networks of other operators |
0.04 |
0.03 |
0.03 |
- |
- |
||||||||||
Other consumption (e) |
0.70 |
0.63 |
0.69 |
0.06 |
9.5 |
||||||||||
Total Italian demand |
70.91 |
75.15 |
72.66 |
(2.49) |
(3.3) |
||||||||||
| Download XLS (19 kB) |
(millions of m3 average/day) |
Calendar year 2016 |
Calendar year 2017 |
Calendar year 2018 |
||||||||||
Entry points |
Transmission capacity |
Transferred capacity |
Saturation (%) |
Transmission capacity |
Transferred capacity |
Saturation (%) |
Transmission capacity |
Transferred capacity |
Saturation (%) |
||||
|
|||||||||||||
Tarvisio |
111.6 |
93.4 |
83.7 |
111.4 |
94.6 |
84.9 |
111.1 |
107.4 |
96.7 |
||||
Mazara del Vallo (*) (**) |
91.5 |
84.9 |
92.8 |
84.4 |
78.3 |
92.8 |
82.0 |
81.2 |
99.0 |
||||
Gries Pass |
64.4 |
22.1 |
34.3 |
64.4 |
22.4 |
34.7 |
64.4 |
34.8 |
54.0 |
||||
Gela (*) |
30.8 |
26.0 |
84.4 |
23.8 |
22.0 |
92.4 |
20.3 |
20.1 |
99.0 |
||||
Cavarzere (LNG) |
26.4 |
24.4 |
92.4 |
26.4 |
24.4 |
92.5 |
26.4 |
24.4 |
92.4 |
||||
Livorno (LNG) |
15.0 |
15.0 |
100.0 |
15.0 |
15.0 |
100.0 |
15.0 |
15.0 |
100.0 |
||||
Panigaglia (LNG) |
13.0 |
0.6 |
4.6 |
13.0 |
2.0 |
15.5 |
13.0 |
4.0 |
30.8 |
||||
Gorizia |
4.6 |
|
|
4.6 |
0.1 |
2.2 |
4.2 |
0.1 |
2.4 |
||||
Competing capacity (*) |
9.7 |
|
|
21.2 |
|
|
24.4 |
|
|
||||
Total |
367.0 |
266.4 |
72.6 |
364.2 |
258.8 |
71.0 |
360.8 |
287.0 |
79.5 |
||||
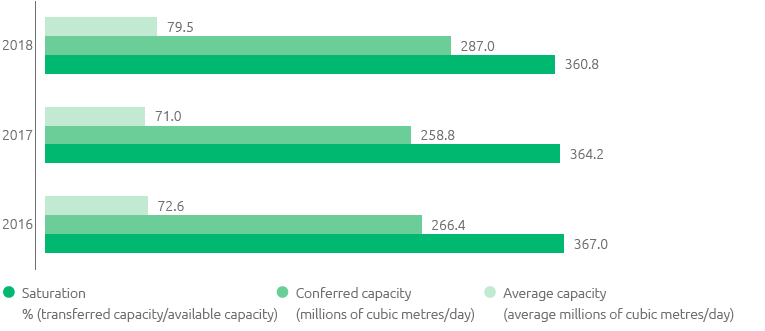
The transportation capacity of the network again covered all user demand in 2018. Average transportation capacity provided at the entry points interconnected with foreign methane pipelines and at regasification plants in 2018 was 360.8 million cubic metres per day, 24.4 of which were offered as competing capacities between the Mazara del Vallo and Gela entry points. In addition to the aforementioned capacities that concern the entry points interconnected with other countries and the LNG terminals, a transmission capacity to the entry points interconnected with national productions, for a total of 19.2 million cubic metres/day and biomethane productions, totalling 0.1 million cubic metres/day is available at the domestic production entry points.
Snam Rete Gas has prepared a long-term plan for available transportation capacity, which was sent to the Ministry of Economic Development on 26 June 2018 and published on the on-line services/capacity section of the Snam website: www.snam.it/it/trasporto.
The document shows data about capacity at all entry points interconnected with foreign countries and with LNG terminals for the thermal year 2017-2018 and subsequent years up to 30 September 2033.
Also shown for the thermal year 2017-2018 are the transport capacities of the interconnected exit points with the foreign countries of Passo Gries, Gorizia, Bizzarone and San Marino at a total of 10 million cubic metres/day. On the Tarvisio exit point, 18 million cubic metres/day of interruptible transport capacity is available, subject to the presence of an incoming physical flow or a null physical flow at the Passo Gries entry point. For the exit point from Passo Gries, there is currently a transport capacity equal, physically, to 5 million cubic metres/day, and works have been completed to build a physical transport capacity of up to 40 million cubic metres/day, offered starting 01 October 2018.
Transmission capacity and saturation
| Download XLS (16 kB) |
|
2016 |
2017 |
2018 |
Active customers (shippers) |
136 |
128 |
136 |
New connection agreements for delivery/redelivery points |
45 |
78 |
88 |
In 2018, 88 connection contracts were signed for the construction of new delivery/redelivery points or upgrading of existing points, of which 14 were for biomethane injection and 43 for CNG (of which 17 from Snam 4 Mobility).
Thanks to the development of the Snam services over the last ten years, the Italian gas market has seen constant growth in the transportation operators, passing from 30 in 2003 to almost 200. Via the PRISMA platform, with the new balancing regime (EU Regulation 312/2014), in operation since October 2016, operators can operate gas exchanges and transmission capacity transactions on an infra-daily, daily, monthly, quarterly or annual basis, for up to a maximum of 15 years.
In 2018, the integration process continued, as had begun in July 2017, which caused the commercial management activities of the three businesses regarding transmission, storage and regasification, to flow into a single organisation. In this regard, a project has been developed that integrates know-how and improves performance: a single Commercial Control Room, which works 24 hours a day, overseeing the Italian gas system, a commitment that envisages specific information obligations envisaged by the Network Balancing Code, such as the hourly publication, on the Snam website, of information on the system balancing status, and the publication, twice a day for each shipper, of information on gas withdrawals, with the main aim of improving the quality of service offered to the client, reducing handling time.
To promote even greater flexibility of the system, in compliance with the Authority's Resolutions no. 336/2016/R/gas and 512/2017/R/gas, the Italian gas system has the possibility of booking monthly and daily transport capacity at the redelivery points, and related withdrawal areas that feed electricity generation plants.
This new mode of access to the gas transport system is combined with the needs of the electricity system to have more flexible assignment methods, so it can respond in a timely and efficient way to changes in the operating conditions of the electricity system.
To manage customer relations, Snam currently uses numerous software applications and web portals that have been developed over time, represent a distinguishing capital for the company and are continuously updated. In particular, Snam provides the Myg@sview Portal, a tool aimed at supporting timely and flexible communications, that allows a set of “smart” data to be personalised according to individual needs, as well as direct communications with them, and inform them via SRG ("chat" mode).
In 2018, this instrument was further implemented, increasing its potential use, also thanks to operator suggestions, with the release to production of new widgets that, for example, with the possibility of extracting the data displayed, indicate the number and details of the points concerned by the reduction and/or interruption of transmission capacity, report the lack of a declaration adhering to the alternative transmission service, indicate the total amount of invoices for Transmission and Balancing, with a list of overdue invoices, those due in the first 15 days of the month and in the next 15 days, showing the situation of the gas held in deposit, space and gas under warranty, divided up by type of service, indicate the gas daily imbalance price.
The comprehensive overhaul of the Snam website was completed, redefining the sections relating to the gas transmission, storage and regasification businesses with the aim of improving use of the information by clients and introducing graphic forms of representation. In 2018, the Company also embarked on a project (Jarvis) aimed at improving the entire commercial platform. During the study phase, workshops were held, dedicated to clients, so as to jointly design the new computer system. In this regard, clients very much appreciated their involvement, as shown by the annual customer satisfaction survey.
Network codes list a number of indicators for monitoring the quality of service offered by the companies. When compared against these indicators, the Snam companies maintained a high level of performance, even in 2018. One part of these indicators, which refers to specific levels of business quality, gives rise to automatic indemnification of customers in the event of a failure to comply with service quality standards.
| Download XLS (16 kB) |
(%) |
2016 |
2017 |
2018 |
Contracted transport capacity/Available transport capacity (foreign entry/interconnection points) |
72 |
71 |
79 |
Compliance with deadlines for issuing offers for connection |
100 |
100 |
100 |
Compliance with deadlines for performing services subject to specific business quality standards |
100 |
100 |
100 |
Organisational changes
During the course of 2018, the number of personnel in service fell by a total of 57, going from 1,972 resources as at 31 December 2017, to 1,915 resources as at 31 December 2018.
In September 2018, the Dispatching and Metering Department was reorganised, with the simplification of the organisational structure, with a view to maximising synergies between the various operating processes.
As part of the SmartGas project, optimisation continued of the various processes in the Operations area, with specific reference to the review of legislation and gas pipeline and compression plants maintenance standards, the activation of new professional roles operating on the territory, the development and implementation of the most advanced IT and digital solutions for the management of operative processes. More specifically, in 2018 the roll-out was completed of SmartGas on all compression plants and the training of all labourers completed towards the move to the new figures of Advanced Maintenance Skill (AMS) and Basic Maintenance Skill (BMS). Finally, the first Specialised Technicians (TECS) were also introduced.
With a view to enhancing and organising the synergic integration of Italian assets and, after the transfer process of the Stogit business unit “Plants and Technical Services” in 2018, the competent departments of Snam Rete Gas in the context of Plant Management, Dispatching & Measurements, Engineering and Construction and Supply Chain, have strengthened and made concrete action aimed at assuring direct control of the operations, maintenance and control activities for storage facilities, storage dispatching operations and engineering activities, and implementation of investment projects related to surface facilities, improvements to plant engineering and the procurement of goods, works and services, in accordance with that defined by the service contracts. More specifically, two mixed storage and transmission poles have been developed for the operation and maintenance of two new compression plants, Minerbio and Sergnano. Additionally, in 2018 the integrated (transmission-storage) dispatch management project was completed.
In October 2018, the General Manager of Engineering and Constructions was appointed, responsible for supervising the development and management of investment projects, along with the General Manager for Gas Operations, responsible for supervising the operation and maintenance of the relevant transmission and storage infrastructures and the dispatch, transmission and storage and metering of gas, with a view to better allocating responsibilities within the specific purviews.
Additionally, 2018 also was the conclusion of the process of integrating the company Infrastrutture Trasporto Gas (ITG) into the Snam Group. The acquisition of Infrastrutture Trasporto Gas made it possible to achieve a better, more synergic management of the Cavarzere-Minerbio methane pipeline, through a specific service contract stipulated by Snam Rete Gas and ITG. In 2018, integration of ITG business and staff into the other group companies’ structures, continued. With a view to obtaining greater efficiency and synergy, most of the people were allocated to cover needs in other group companies, after training, where necessary. The activity has now been completed, apart from one person who will be integrated in the first part of 2019.
Finally, as part of the project to rationalise and simplify the current Snam regulations, 6 new rules were issued, which will simplify and standardise the operative processes.
As compared with 2017, the management actions linked to the generational mix change have made it possible to fight the normal “ageing” of the population by one year and further rejuvenate the overall average age, which goes from 46.8 in 2017 to 46.1 in December 2018.
Accidents
In 2018, the number of accidents was booked as 4 for employees and 3 for contract workers.
| Download XLS (16 kB) |
(no.) |
2016 |
2017 |
2018 |
Total employee accidents |
1 |
2 |
4 |
Total contract worker accidents |
4 |
4 |
3 |
| Download XLS (17 kB) |
|
2016 |
2017 |
2018 |
||||
|
|||||||
Employees |
|
|
|
||||
Frequency index (*) |
0.32 |
0.66 |
1.29 |
||||
Severity index (**) |
0.004 |
0.03 |
0.03 |
||||
Contract workers |
|
|
|
||||
Frequency index (*) |
0.65 |
0.47 |
0.46 |
||||
Severity index (**) |
0.05 |
0.90 |
0.03 |
||||
Energy consumption and emissions
In accordance with its sustainable growth model, the company has set voluntary targets for the reduction of its natural gas emissions by 2022 and 2025 respectively as 15% and 25%, net of emergencies, with respect to 2016 values; this objective is valid for all Snam’s businesses (transmission, storage, regasification).
In 2018, the emission into the atmosphere was avoided of 8.2 million cubic metres of natural gas, equal to approximately 142,200 tonnes of CO2eq (+ 99% on the 71,500 tonnes of CO2eq in 2017). This performance was made possible thanks to gas recompression interventions in the line (13 interventions carried out as compared with the 8 in 2017) and interventions with tapping machines, a technology that can detach methane pipelines operating for new connections without interrupting service. These results led to a reduction in 2018 natural gas emissions of 7.9% on 2016, a trend that is entirely in line with the general objective.
Total avoided CO2 emissions in 2018 deriving from the various initiatives adopted by the company (lack of natural gas emissions, electricity production by photovoltaic plants, purchase of green electricity, installation of LED lamps in lieu of other lighting bodies, smart working) have made it possible, globally, to avoid the release into the atmosphere of a total of 154,800 tonnes of CO2.
Energy consumption for transport, which depends on a series of factors, some of which are beyond the control of the transporter, insofar as they are determined by the commercial decisions made by the user (e.g. gas injection points and backbones used) are basically unchanged on 2017. In 2018, nitrous oxide emissions totalled approximately 305 tonnes (+ -10.7% compared to 2017). To limit polluting emissions, a programme that calls for modifying certain turbines already in operation and the installation of new units with low emission combustion systems (Dry Low Emissions) has been in progress for years. In 2018, 5 new turbines were introduced to DLE at thrust plants (TC1-2-3 in Sergnano and TC1-2 in Minerbio).
| Download XLS (17 kB) |
|
2016 |
2017 |
2018 |
||
|
|||||
Energy consumption (TJ) |
5,824 |
7,459 |
7,463 |
||
Emissions of CO2eq - scope1 (ton) (*) |
921,954 |
1,008,051 |
981,866 |
||
Natural gas emissions (106 m3) |
34.6 |
34.4 |
32.8 |
||
Natural gas recovered (106 m3) |
4.5 |
4.1 |
8.2 |
||
NOx emissions (tonnes) |
228 |
342 |
305 |
||