Key financial-economic results
Thanks to the solidity of the operational management and to the strict financial discipline, in 2017 Snam achieved results in line with the expectations.
The financial year closed with a net profit of €897 mln, with an increase of €306 mln (+51.7% compared to the 2016 net profit referring to the continuing operations amounting to €591 mln).
For a better assessment of group performance and greater data comparability, Snam drafted the “adjusted”4 profit/loss measurements that exclude the effects of non-recurring transactions. Furthermore, also due to the discontinuity factors that characterised FY 2016 (the separation of the gas distribution activities), referring to FY 2016, the adjusted results reflect the Italgas Group’s contribution to continuing operations, obtained by applying the relative portion of shares, amounting to 13.5%, to Italgas Group’s net profit for the entire year (pro-forma adjusted data).
The adjusted net profit amounted to €940 mln, with an increase of €95 mln (+11.2% with respect to the adjusted pro-forma net profit for 2016). This increase, in addition to an higher operating profit (+€27 mln) attributable to higher revenues from regulated activities, reflects an efficient financial management (+€36 mln), and greater net income from equity investments (+€15 mln), as well as income taxes (+€17 mln) mainly due to the reductionof the Ires rate from 27.5 to 24.0% starting on 1 January 2017, partly offset by higher income before taxes.
In 2017, a cash flow of €1.9 bln was generated from operations, allowing the full funding of financial requirements related to net investments and the generation of Free Cash Flow amounting to €0.4 bln.
The net financial debt, after paying the €0.7 bln dividend to shareholders and the cash flow resulting from the purchase of treasury shares, recorded an increase of €0.5 mln with respect to 31 December 2016.
Added value generated and distributed
The Company produces wealth contributing to the economic growth of the society and the environment in which it operates, and it measures this wealth in terms of added value produced and distributed to its key stakeholders.
In 2017, the total gross added value Snam produced amounted to €2,447 mln, down slightly (€71 mln, equal to 2.8%) from 2016 (€2,518 mln), primarily as a result of the effects of separating the natural gas distribution activities from Snam, concluded in 2016, which generated an extraordinary financial income related to reimbursement to Snam from the companies that were the subject matter of the demerger, of the existing financial debts at their respective market value.
| Download XLS (16 kB) |
(€ million) |
2015 |
2016 |
2017 |
||
|
|||||
Added value produced (A) |
2,429 |
2,518 |
2,447 |
||
Added value distributed (B) |
1,831 |
1,913 |
1,621 |
||
Employees |
238 |
260 |
249 |
||
Local communities |
3 |
3 |
5 |
||
Lenders (Bondholders and Banks) |
347 |
610 |
292 |
||
Shareholders |
875 |
718 |
732 |
||
Government |
369 |
323 |
343 |
||
Direct taxes |
357 |
308 |
329 |
||
Indirect taxes |
12 |
15 |
14 |
||
Added value retained by the Company (A) - (B) |
598 |
605 |
826 |
||
Distribution of value added (%)
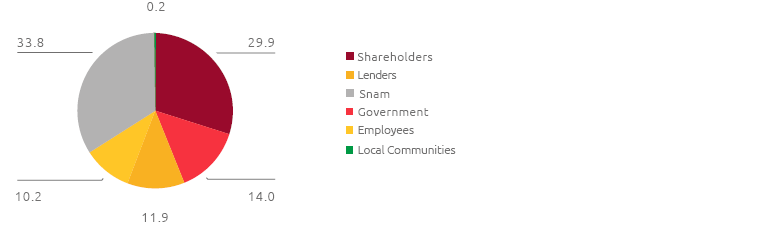
With regard to the main reference stakeholders, Added Value was distributed as follows:
- Employees 10.2% (-0.1 percentage points compared to 2016) in the form of direct compensation consisting of wages, salaries and severance pay and indirect compensation consisting of social security contributions and staff-related service costs (canteen services, reimbursement of travel expenses);
- Government 14.0% (+1.2 percentage points compared to 2016) – through the payment of direct and indirect taxes. The increase is mainly attributable to greater income before taxes, despite the reduction of the IRES rate from 27.5 to 24.0% (since 1 January 2017);
- Shareholders 29.9% (+1.2 percentage points compared to 2016) – through distributed dividends. The value delivered increased despite the smaller number of shares outstanding following the buyback of treasury shares by Snam under the share buyback programme launched in November 2016;
- Lenders 11.9% (-12.3 percentage points compared to 2016). Reduction in response to the benefits arising from optimising activities implemented during 2016 and 2017, in particular the liability management operation completed in October 2016.
The 33.8% (+9.8 percentage points compared to 2016) of Added Value produced was also reinvested within the company and approximately 80% was allocated to depreciation/amortisation of tangible and intangible fixed assets used in the production process (100% in 2016).
Lastly, approximately €5 mln was designated for local communities (0.2% of the value generated) through donations and sponsorship initiatives and environmental compensation pursuant to the law.
Relations with the financial community
Snam believes that maintaining constant relations with investors and the entire financial community is of strategic importance for its reputation. In this respect, it endeavours to disseminate comprehensive and timely information, capable of effectively representing the business’s strategy and performance, particularly enhancing the dynamics that ensure the creation of value over time.
In addition to the ongoing meetings and initiatives, Snam makes multiple economic and financial publications regarding business performance and the sustainability projects and initiatives developed by the Company.
2017 Engagement activity
The presentation of the Strategic Plan and conference calls upon the publication of the Company’s results (annual, semi-annual and quarterly). In 2017, the followings were carried out:
- 18 road shows to meet shareholders and institutional investors at the major financial centres of Europe and North America;
- 5 industry conferences allowing investors specialising in the utility and infrastructure sectors to meet Snam’s senior management;
- 115 one-to-one meetings between Snam’s management and investors, in addition to numerous group meetings (for a total of 213 meetings).
Meetings were also held with 34% of the SRI investors, out of the total number registered in the shareholder structure
4 See Financial Report for greater details.