Indirect CO2eq Emissions (Scope 2)
Indirect energy CO2eq emissions are due to the procurement of electricity and heat produced by third parties and used by Snam for its activities. Indirect emissions are calculated both through the Market Based approach (MB), which allocates a zero CO2eq emission factor for the energy consumption from certified renewable sources, and a Location Based approach (LB), that considers an average CO2eq emission factor for the national electricity grid.
Electricity consumption, equal to around 117,380 MWh, increased by 12% compared to 2018. Specifically, the increased consumption is due to the LNG regasification facility, which, in 2019, regasified a greater quantity of gas, and the Digital Transformation and Technology (DT&T) activities for the redistribution and movement of the data centres. The greater consumption resulting from the LNG site was completely neutralised in terms of Scope 2 emissions thanks to the procurement of green electricity, while the emissions due to the greater consumption recorded on the other sites were partly mitigated by a new gas power plant switching to an electricity power plant certified as renewable on the Enna site. This plant joins those of Messina and Terranuova B. (SRG), Brugherio (STG), the Panigaglia LNG Plant and several areas of Snam4Mobility.
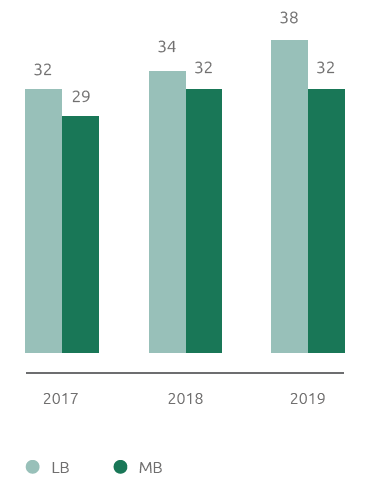
CO2eq emissions calculated according to the MB method stood at around 32 thousand tonnes, in line with 2018 in spite of an increase in total electricity and heat consumption of 13% if calculated using the LB method, evidence of the continuous increase in energy produced from renewable sources.
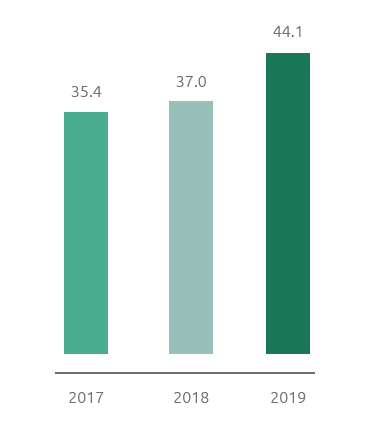
Specifically, the ratio between the use of electricity produced from renewable sources and total electricity consumption increased further going from 37% in 2018 to 44% in 2019, thereby preventing the emission into the atmosphere of around 16,100 tonnes of CO2eq (+4,000 t compared to 2018).
Indirect GHG emissions Scope 2 (kt CO2eq)
Green electricity/Electricity consumption (%)