Energy consumption
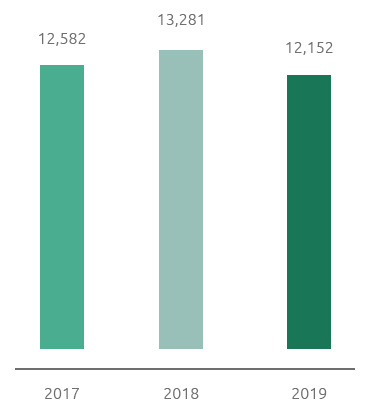
2019 total energy consumption:
-8.5%
compared to 2018
In 2019 the total energy consumption stood at 12,152 TJ (-8.5% compared with 2018) in spite of an overall increase in the gas injected into the network (+3.5%). This result was facilitated by the fact that, compared to 2018, the gas was imported from less energy-intensive routes, namely there was less use of the North Africa backbone network.
Energy consumption (TJ)
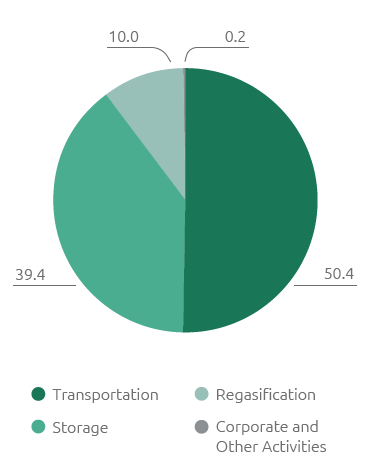
Energy consumption by activity (%)
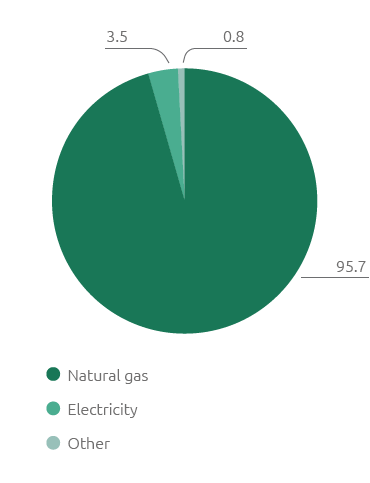
Natural gas
95.7%
on total energy mix used
The energy mix used by the Company is made up almost totally of natural gas (95.7% of the energy requirements). Other sources used are electricity (3.5%), other fuels (diesel, oil, LPG) and heat, which together represent the 0.8% of consumption. Most of the Snam’s energy consumption is due to the gas turbines used in the compression systems which provide the pressure required for gas transportation (thrust consumption) and to storage activities, which, overall, represent the 81% of total consumption, down by 88% from 2018.
In 2019 there was an increase in the energy consumption for the gas regasification plant, equal to the 10% of the Group’s total consumption (3.5% in 2018). This is due to the increase in the quantity of regasified gas (+170%).
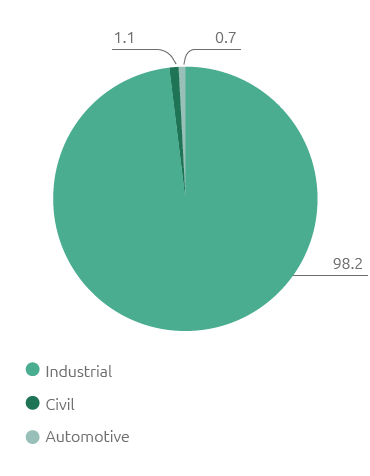
Energy consumption by source (%)
Energy consumption by use (%)