Employment
Snam offers a stable, continuous working relationship (93.1% of people are on a permanent employment contract) and hires highly qualified and specialised resources (57% of employees have a technical diploma and 27% are graduates). At the end of 2019, there were 38 part-time contacts and 193 apprenticeship contracts in force. During the year there were over 32 employees on a staff leasing contract (33 in 2018 and 2017).
| Download XLS (23 kB) |
|
2017 |
2018 |
2019 |
|---|---|---|---|
Executives |
93 |
107 |
111 |
Managers |
456 |
480 |
493 |
Administrative staff |
1,655 |
1,682 |
1,683 |
Manual workers |
715 |
747 |
738 |
Total Employees |
2,919 |
3,016 |
3,025 |
|
|
|
|
Graduates |
676 |
777 |
819 |
With diplomas |
1,664 |
1,703 |
1,714 |
Other qualification |
579 |
536 |
492 |
| Download XLS (23 kB) |
|
2017 |
2018 |
2019 |
||
|---|---|---|---|---|---|
|
|||||
Permanent contract (*) |
2,755 |
2,812 |
2,817 |
||
Apprentice or first employment contract |
150 |
185 |
193 |
||
Fixed-term contract |
14 |
19 |
15 |
||
Part time |
42 |
41 |
38 |
||
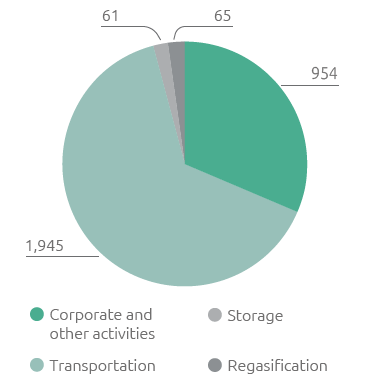
Employees by activity (no.)
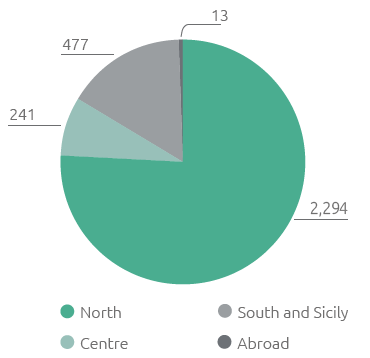
Distribution of employees by geographical area (no.)
Top Employers
The international “Top Employers” ranking by Statista in partnership with Forbes, ranked Snam among the top 150 companies in the world to work in. The list, which includes Snam and one other Italian company, is based on 2,000 global companies with the best reputation, based on 1.4 million interviews at a global and regional level.
Employment dynamics
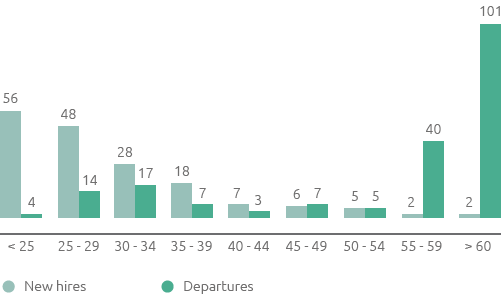
In 2019 a total of 231 entries were recorded of which 172 were hired from the market, 8 from the consolidation of the TEA S.r.l. (from December 2019), 47 from the acquisition of RENERWASTE (from December 2019) and 4 returning from leave.
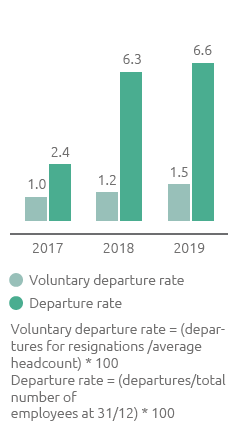
On the other hand, there were 222 departures, 77 were early retirement, 12 for other reasons, 12 transfers to non-consolidated companies and 121 through the termination of employment (53 of which were unilateral terminations).
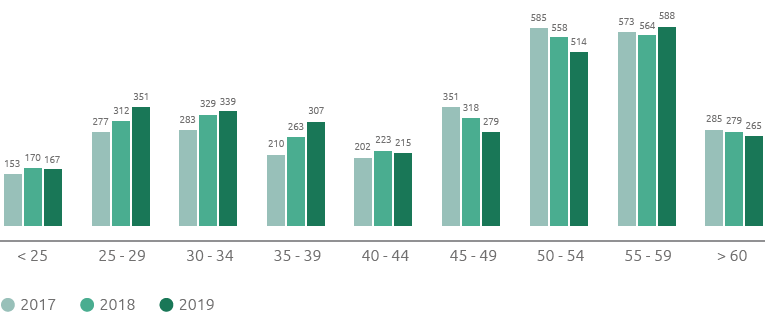
People aged under 40(1,164) represent the 38.5% of the corporate population, an increase of 90 resources compared with 2018, also thanks to the inclusion of young talent in recent years.
Age diversity: employees by age brackets (no.)
Departure rates (%)
Entries and departures from market by age groups (no.)
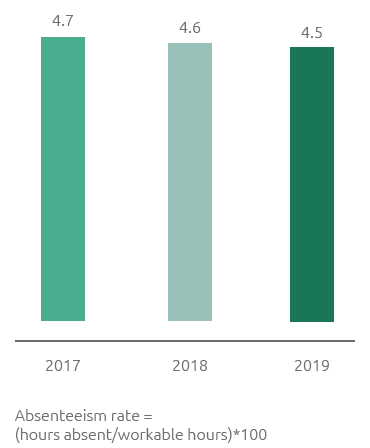
The absenteeism rate, which in 2019 stood at 4.5%, was essentially aligned to the previous years, does not include senior management and was calculated taking into consideration all hours not worked (paid and unpaid) excluding holidays, leaves and periods of mandatory and voluntary maternity leave. There were no essential changes between the absenteeism rate for men and women, which stood at 4.4% and 5,1%, respectively.
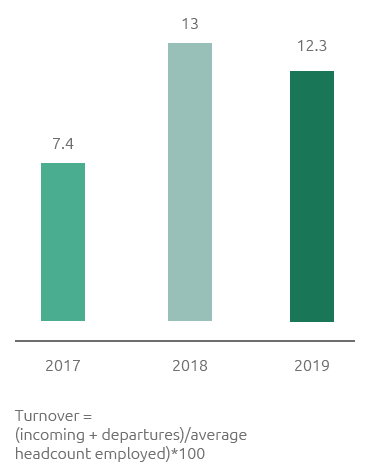
The turnover rate for 2019, remained consistent with the 2018 figure thanks to the hiring campaigns and the support of early retirement, as well as acquisitions completed during the year.
Absenteeism rate (%)
Personnel turnover (%)