Key financial figures(1)
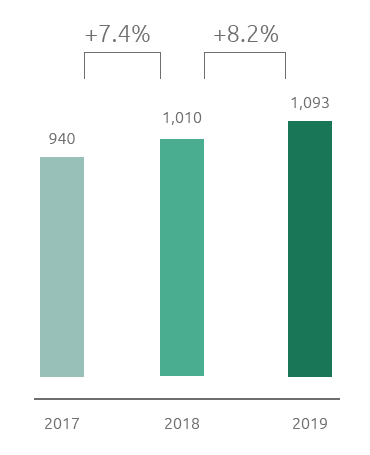
Adjusted EBIT (mln €)

In 2019 Snam demonstrated it was in line with its expectations and those of its investors, achieving positive results thanks to the rigorous and efficient management of its financial assets. As evidence of this, EBIT rose 0.9% compared with 2018, reaching €1,417 million.
Adjusted net profit stood at €1,093 million, an increase of €83 million compared with 2018 (+8.2%). This increase, in addition to the greater EBIT (€12 million, +0.9%), is due to lower net financial expense (+€30 million or 15.4%), thanks to the benefits of the actions designed to optimise the existing financial structure. In addition, the positive market conditions and the greater net income from equity investments (€57 million or +35.8%), thanks to the contribution of Senfluga, a company purchased in December 2018, and Teréga, contributed to achieving this result. These effects were partly absorbed by higher income taxes, -€16 million, mainly attributable to the greater pre-tax profit. Net financial debt was €11,923 million as at 31 December 2019, compared with €11,548 million as at 31 December 2018.
Added Value produced and distributed
For Snam, sustainability and creation of value are closely related concepts: sustainability creates value for the company and stakeholders, bringing together the business and social responsibility of the company. Through its activities, Snam produces wealth that contributes, directly and indirectly, to the economic growth of the context in which it operates. This wealth is often expressed in terms of Added Value produced and distributed to its reference stakeholders.
Snam calculates the Added Value based on the standard prepared by the Gruppo di Studio per il Bilancio Sociale (GBS) (Sustainability Report Study Group) and GRI Standards, the national and international reference frameworks, respectively, for identifying and calculating the sustainability indicators of a business. Specifically, the GBS is an association dedicated to the development and promotion of scientific research into the Sustainability Report and issues relating to responsible management processes for businesses.
The Added Value is calculated based on the values taken from the legally-required Income Statement, thereby becoming a useful tool for all stakeholders in understanding the economic impacts that the Group produces. In 2019, the gross global Added Value produced was €2,695 million, an increase of €163 million compared with 2018 (+6.4%).
| Download XLS (24 kB) |
|
2017 |
2018 |
2019 |
|---|---|---|---|
Added Value produced (A) |
2,447 |
2,532 |
2,695 |
Added Value distributed (B) |
1,621 |
1,634 |
1,639 |
Employees |
249 |
280 |
258 |
Local community (Donations and sponsorship Statutory environmental compensation) |
5 |
3 |
3 |
Lenders (Bondholders and Banks) |
292 |
249 |
211 |
Shareholders |
732 |
746 |
780 |
Government |
343 |
356 |
387 |
Direct taxes |
329 |
341 |
375 |
Indirect taxes |
14 |
15 |
12 |
Added value retained by the Company (A) – (B) |
826 |
898 |
1,056 |
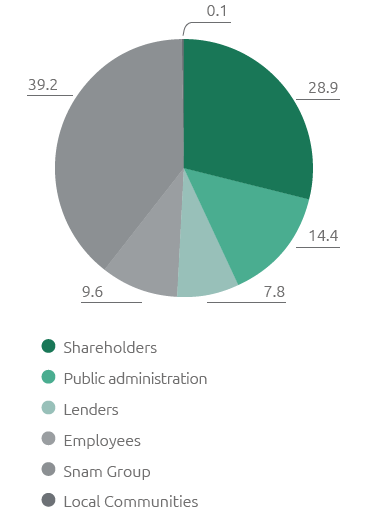
Distribution of added value (%)

The 39.2% of gross global Added Value produced was reinvested within the Group and is 3.7% higher than 2018. Of this, around 68.4% was allocated to the depreciation of assets. Regarding the main reference stakeholders, 2019 saw a 2% reduction in the value distributed to lenders (7.8%), due to a reduction in financial expense following the actions to optimise the financial structure launched in the previous three-year period and, specifically, the liability management operations. The value distributed to shareholders (28.9%), through the dividends paid, was consistent with the 2018 figure (29.5%). In order to guarantee attractive and sustainable remuneration for shareholders, Snam bought treasury shares, under the scope of the share buyback programme, reducing the outstanding number of shares and contributing to the growth in value of a single share by 5% compared with 2018.
With reference to employees (9.6%), the distribution took place directly, through salaries, wages and employee severance indemnity, and indirectly through social security contributions and staff-related costs (canteen services, reimbursement of travel expenses). There was a reduction in the Added Value distributed to employees, equal to -1.5% compared with 2018, due to the extraordinary components reported in 2018, relating to costs for redundancy packages, with the application of the early retirement tool regulated by Article 4, paragraphs 1-7 of Law 92/2012 the Fornero Law.
The value allocated to the Public Administration (14.4%) through the payment of direct and indirect taxes was essentially stable (+0.4% compared with 2018). Lastly, an amount of approximately €3 million was designated for local communities (0.1%) through donations and sponsorship and environmental compensation pursuant to the law.
1) For more details, see the 2019 Annual Financial Report