Climate protection
Greenhouse gases (GHG) emitted into the atmosphere by Snam operations are carbon dioxide CO2 and methane (CH4), a primary component of natural gas. The CO2 produced is directly related to fuel consumption, while methane emissions are triggered by the release of natural gas into the atmosphere resulting from the regular operation of systems, the connection of new pipelines and maintenance works on them or accidental events involving infrastructures.
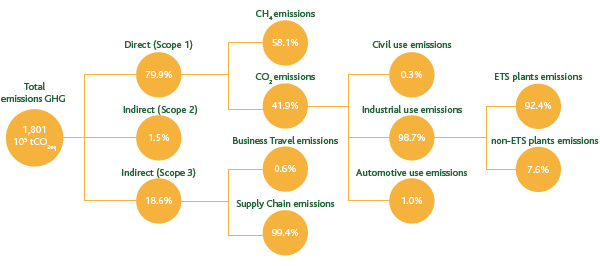
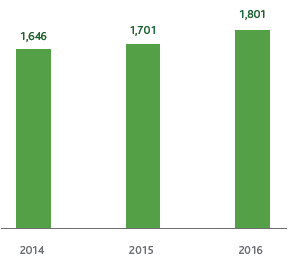
In 2016, total GHG emissions (direct Scope 1, indirect Scope 2 and Scope 3) stood at 1.80 million tonnes of CO2eq (1.70 million tonnes in 2015). The increase in emissions (+5.9% compared with 2015) is mainly due to gas transportation activities which saw a rise in the gas injected into the network from 67.25 billion cubic metres in 2015 to 70.63 billion in 2016.
Thanks to the actions implemented during the year, the emission into the atmosphere of 85,770 tonnes of CO2eq has been prevented.
GREENHOUSE GAS EMISSIONS
TOTAL DIRECT GHG EMISSIONS - SCOPE 1-2-3 (ktCO2eq)
The 2016 initiatives to reduce natural gas emissions involve:
- recompression of the gas in the transportation system and at the compression stations;
- replacement of natural gas powered pneumatic actuators in the transportation and storage infrastructures.
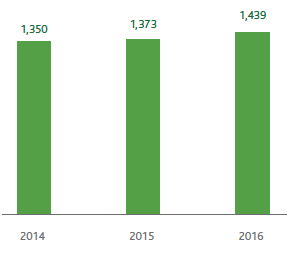
Direct emissions of CO2eq (Scope 1)
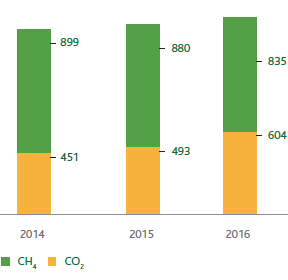
In 2016, direct CO2eq emissions were equal to approximately 1.44 million tonnes (+4.8% compared with 2015). Direct CO2 emissions from combustion were equal to approximately 0.6 million tonnes (+22.5% compared with 2015), while CO2eq emissions from methane stood at approximately 0.835 million tonnes.
The measurement of CO2eq was carried out in accordance with the latest scientific study of the Intergovernmental Panel on Climate Change (IPCC) “Fifth Assessment Report IPCC” which gave methane a Global Warming Potential (GWP) score of 28.
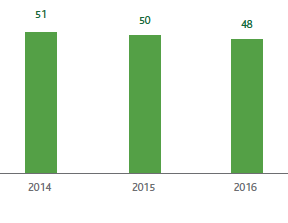
Specifically, natural gas emissions were reduced in 2015, (-3%), going from 49.7 Mm3 to 48.2 Mm3 as a result of both the lower emissions from emergencies and the greater recovery of gas in the transportation system (4.5 million cubic metres of natural gas recovered, equal to 77,780 tonnes of CO2eq).
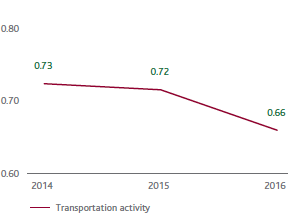
In transportation activities, methane emissions per kilometre of the network fell from 0.72 tonnes in 2015 to 0.66 tonnes per kilometre (-9%).
TOTAL DIRECT GHG EMISSIONS - SCOPE 1 (ktCO2eq)
TOTAL DIRECT GHG EMISSIONS - SCOPE 1 (ktCO2eq)
NATURAL GAS EMISSIONS (106m3)
METHANE EMISSIONS/LENGHT OF NETWORK (t/km)
| Download XLS (17 kB) |
Description of KPI |
KPI data |
Pre-set target |
Target reached in 2016 |
Sector |
Activity status |
||
|
|||||||
Natural gas recovered over total potential emissions from maintenance activities |
2015 |
Recover 30% every year (until 2018) |
37 |
Transportation |
|
||
Contain natural gas emissions in the transportation network |
2014 |
Keep annual natural gas emissions below 1,240 m3/km until 2017 |
1,066 |
Transportation |
|
||
Indirect emissions of CO2eq (Scope 2)
In 2016 Snam increased its consumption of electricity from renewable sources still further: four energy-intensive plants use electricity procured from renewable sources and various transportation and storage system sites use electricity produced from locally installed photovoltaic panels.
Indirect emissions of CO2eq come from the production of electricity by third-parties and which Snam uses for its operations.
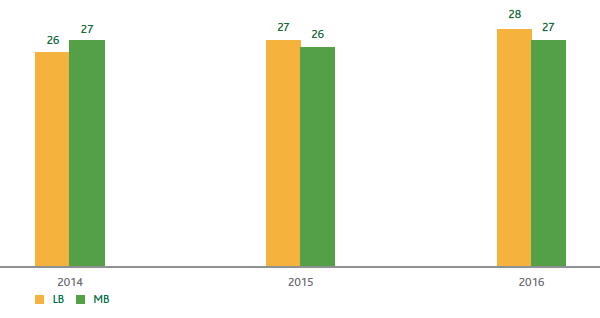
In 2016, these emissions were recalculated and compared, for previous years as well, according to the most recent best practices, adopting two approaches called Market Base (MB) and Location Base (LB).
In 2016 indirect emissions of CO2eq calculated using the MB approach were equal to 27,390 tonnes (+3.6% compared with 2015), while the same emissions measured using the LB approach stood at 28,280 tonnes, a 5.1% increase compared with the previous year.
INDIRECT GHG EMISSIONS - SCOPE 2 (ktCO2eq)
In the course of the year Snam has increased use of electricity produced from renewable sources therefore preventing the emission into the atmosphere of approximately 7,630 tonnes of CO2eq equal to approximately 27% of the company’s total indirect emissions (Scope 2).
The comparison between these two values highlights the impact on emissions of using energy produced from renewable sources. Snam has increased its consumption of the latter in 2016 as well, therefore preventing the emission into the atmosphere of approximately 7,630 tonnes of CO2eq equal to approximately 27% of the company’s total indirect emissions (scope 2).
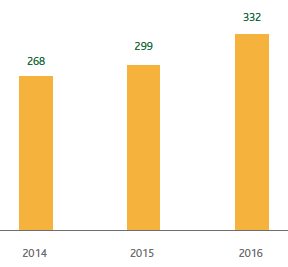
Indirect emissions of CO2eq (Scope 3)
Scope 3 indirect emissions totalled approximately 334,000 tonnes and refer, for 99%, to CO2eq emissions related to supply chain with the residual part related to business travel. They are calculated by applying a method developed by a leading international company which analyses the carbon footprint.
The 11% increase in emissions compared with 2015 is due to the greater amount of procurement activated by the supply chain.
INDIRECT GHG EMISSIONS - SCOPE 3 (ktCO2eq)
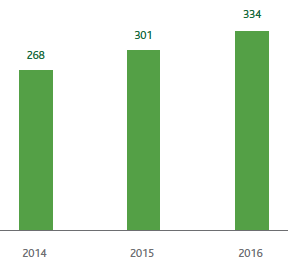
INDIRECT GHG EMISSIONS - SCOPE 3-SUPPLY CHAIN (ktCO2eq)
GRI-G4:EN19,EN15,EN16,EN17