Energy consumption
Natural gas represented
96.4%
of the Company’s energy requirements
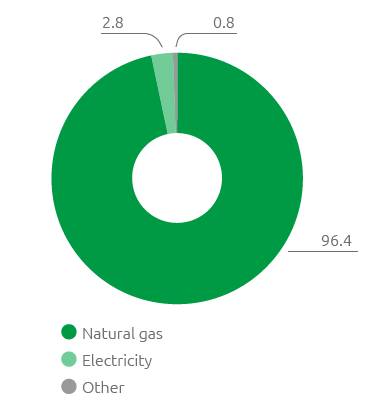
The Snam energy mix, in line with the company’s commitment to fighting climate change, is composed almost entirely of natural gas. In 2018, natural gas represented 96.4% of the Company’s energy requirements.
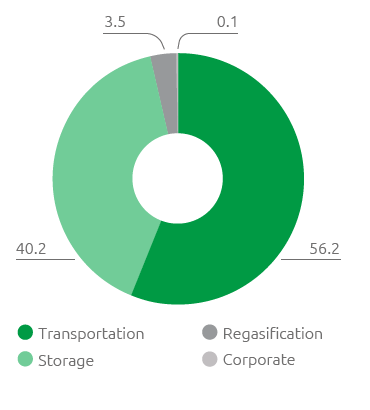
Snam’s main energy consumption is due to gas turbines used in the compression plants that provide the pressure needed to transport gas (boost consumption) and storage concessions (storage consumption), which globally represent 88% of total consumption.
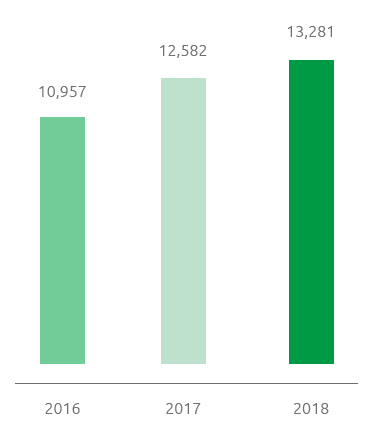
In 2018, energy consumption totalled around 13,281 TJ (+5.6% compared with 2017). This increase is mainly due to greater natural gas consumption due to the increase in the quantity of gas stored in deposits (+9%).
The energy consumption from transportation, which depends on a series of factors, some of which are out of the Company’s control because they are depend on the commercial decisions of customers (e.g. gas delivery and collection points and therefore which backbone corridor is used), have essentially remained unchanged compared with 2017 in spite of two new stations (Minerbio and Sergnano) coming into service which has led to greater consumption of fuel gas through their commissioning.
The energy consumption from the regasification activity, which has a relative low weight on total consumption (3.5%), increased by 42% compared with 2017, perfectly in line with the increase in the quantity of gas regasified.
In addition to natural gas, the other energy sources are electricity (2.8%) and other fuels (diesel fuel, petrol, LPG and heat), which together amount to 0.8% of the total consumption.
Energy consumption (TJ)

Energy consumption by activity (%)

Energy consumption by source (%)

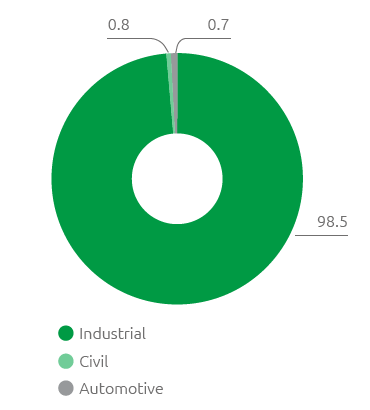
Energy consumption by use (%)

The future is already out there
There was an advertising campaign in 2018 dedicated to biomethane and energy efficiency. The multi-channel communication project was aimed at a wide-ranging audience with the objective of publicising the company’s commitment to the decarbonisation of cities through the use of renewable gas and the optimisation of energy consumption. In addition to social networks and digital media, the campaign, with the slogan “The future is already out there”, was released throughout the country and in Milan, specifically, through images telling of the importance of the circular economy and the energy efficiency of buildings to improve air quality and the battle against climate change.