Energy consumption GRI - G4: EN3, EN6
The Group’s main energy consumption is due to the gas turbines used in compression stations to provide gas with the pressure necessary for transportation (compression consumption) or storage (storage consumption).
To limit energy consumption, the best available technologies are used. The fuel consumption of the compression stations is controlled by the dispatching unit through the use of software systems that make it possible to manage the transportation network as efficiently as possible, in keeping with transportation and storage needs, with an optimal configuration of the individual plants.
In 2015, total energy consumption was around 9,658 TJ, up 9% compared with 2014.
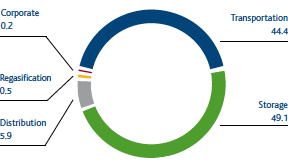
This increase was due to the greater quantities of gas transported (+8% compared with 2014) and stored (more than 20% compared with 2014). In particular, the rise in stored gas was considerably greater than the rise in consumption, due to the increasingly extensive use of high-efficiency turbines to improve energy performance.
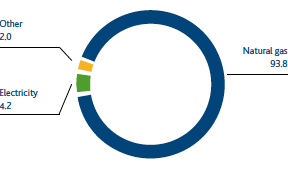
The energy source most used was natural gas, which covered 93.8% of the total energy needs. The other sources used were electricity (4.2%) and other fossil fuels (diesel oil, petrol, LPG and heat), which together amount to 2%.
Energy consumption (TJ)
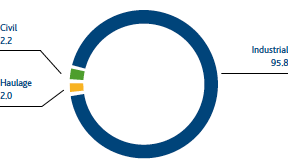
Energy consumption by activity (%)
Energy consumption by use (%)
Energy consumption by source (%)
Green Data Centre
Snam’s new Green Data Centre, which houses the Group’s entire IT infrastructure, was acquired in 2015. Energy efficiency is a key factor in the IT systems revolution to which the company has been committed for years. The data centre relies on a redundant power supply source which significantly reduces energy leakage and more than 75% of the time uses outside air for heat disposal and server cooling, reaching a Power Usage Effectiveness (PUE) value – understood as the ratio between the total electricity consumption of a data centre and that of only the IT devices – of less than 1.2.
Production and the use of energy from renewable sources GRI – G4: EN3
Being aware of the importance of using energy from renewable sources, the Company has launched programmes that involve the installation of photovoltaic facilities in its buildings (local headquarters and maintenance centres) and in some natural gas withdrawal and pressure reduction stations in the distribution network.
| Download XLS (23 kB) |
|
2013 |
2014 |
2015 |
||||||||
Type |
(no.) |
Total Capacity |
Energy Produced |
(no.) |
Total Capacity |
Energy Produced |
(no.) |
Total Capacity |
Energy Produced |
||
|
|||||||||||
Wind generators |
1 |
1.5 |
202,259 |
1 |
1.5 |
477,213 |
1 |
1.5 |
740,082 |
||
Photovoltaic plants |
802 |
478.5 |
951 |
611.5 |
1,043* |
818.5 |
|||||
Solar thermal plants |
|
|
|
|
1 |
151 |
|||||
Total |
803 |
480 |
952 |
613 |
1,045* |
971 |
|||||
The installed power of the Snam Group’s renewable source plants increased by 358 kW compared with 2014, from 613 kW to 971 kW (+58%) due to the new photovoltaic plants connected to the network in the course of the year and the solar thermal plant. The total number of plants rose from 952 to 1,045 (+9.8%), essentially as a result of the new back-up systems for the monitoring of gas redelivery point plants.
The total energy produced by renewable source plants increased significantly compared with 2014, from 477,000 kWh in 2014 to 740,000 kWh in 2015 (+55%). This increase was due to the new plants installed in 2015 as well as the connection of plants installed in previous years that had not yet been connected to the network.


