Snam respects the dignity of everyone and offers equal opportunities in all phases and all aspects of employment, avoiding any form of discrimination that may arise from differences in gender, age, state of health, nationality or political or religious opinions.
The Group employs 306 people with disabilities, whose development programmes focus on training and integration into corporate processes. There is not a significant presence of ethnic and linguistic minorities in our workforce, partly due to the fact that Snam operates only in Italy.
How Snam promotes equal opportunities
Area |
Initiatives |
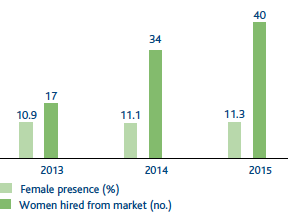
Women at Snam |
- 11.3% of the company’s population is female (15% of the people hired during the year are women).
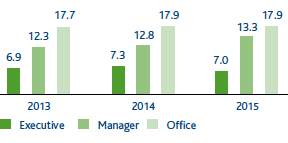
- 7% of the company’s executives and 13.3% of the managers are women.
- One of the Group’s 3 new executives, appointed in July 2015, is a woman.
- The ratio of women to men in top positions is 13%, although this percentage has the potential to increase in the future. Indeed, 33.3% of the managers participating in the Leadership Development programme are women and women account for 38.8% of the High Flyers.
|
Support for parents and work-life balance |
- A total of 38 workers (of which 28 women) took maternity or paternity leave in 2015. At the end of 2015, 21 people returned to work; there are still 17 active positions (26 in 2014). Employees keep their company benefits while on maternity leave, and during the mandatory leave period, they receive maternity pay at 100% of the salary of the month prior to commencement of leave (compared with 80% as required by law).
- During the year 478 employees went on parental leave (97 women) and 424 positions were closed (of which 423 returned to work). Therefore, there are still 54 active leave positions (9 women and 45 men).
- At the end of 2015, there were 92 part-time contracts in force. Snam and the law provide opportunities for hours/periods away from work, depending on the personal situations of employees.
|
Staff training by gender (no.)
|
2013 |
2014 |
2015 |
Average training hours delivered to men (hours/year) |
32.7 |
30.2 |
26.6 |
Average training hours delivered to women (hours/year) |
33.6 |
17.4 |
16.8 |
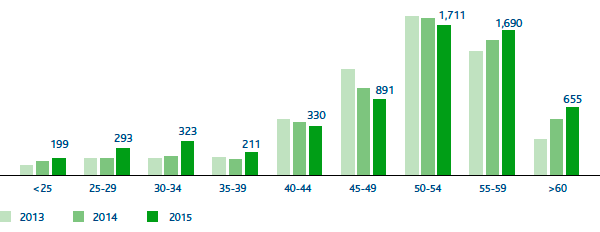
Age diversity: employees by age group (no.)
Female presence by role (%)
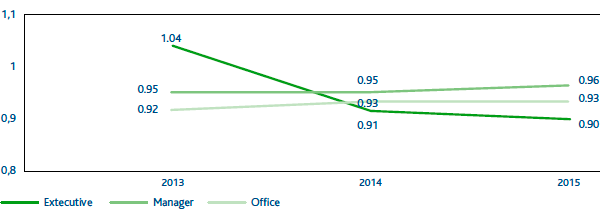
Women/men pay differential