Direct CO2eq emissions (Scope 1)
In 2018, tons of CO2eq avoided
154,800
In 2018, the various initiatives undertaken by the Company (lost natural gas emissions, the production of electricity from photovoltaic plants, the acquisition of green electricity, the installation of LED bulbs to replace other light fittings, smart working) made it possible for us, globally, to prevent the emission of 154,800 tonnes of CO2eq into the atmosphere.
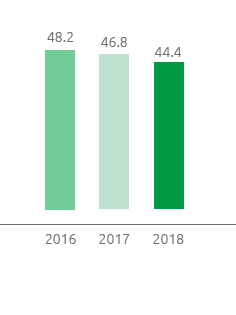
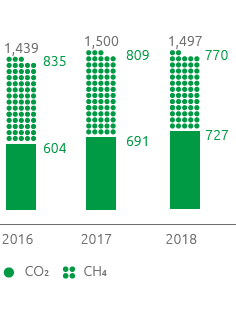
In 2018 direct CO2eq emissions amounted to approximately 1.5 million tonnes (stable compared with 2017). CO2 emissions from combustion amounted to approx. 0.727 million tonnes (+5.2% compared with 2017), whereas the CO2eq emissions deriving from the methane emissions amounted to approximately 0.77 million tonnes (-4.8% compared with 2017). Natural gas emissions were equal to 44.4 Mm3, down compared with the figure of 46.8 Mm3 in 2017.
The company, in accordance with its sustainable growth model, sets the targets to reduce its natural gas emissions by 2022 and 2025, respectively, by 15% and 25%, excluding emergencies, compared with 2016.
In 2018, 8.2 million cubic metres of natural gas were prevented from being emitted, equal to around 142,200 tonnes of CO2eq (+99% compared with the figure of 71,500 tonnes of CO2eq. in 2017). These performances were made possible by the recompression of line gas (13 operations compared with 8 in 2017) and interventions with tapping machines, a technology that makes it possible to detach methane gas pipelines in operation for new connections without a break in service. These initiatives led to a decrease in natural gas emissions by 7.9% compared with 2016, a trend which is absolutely in line with the general reduction goal.
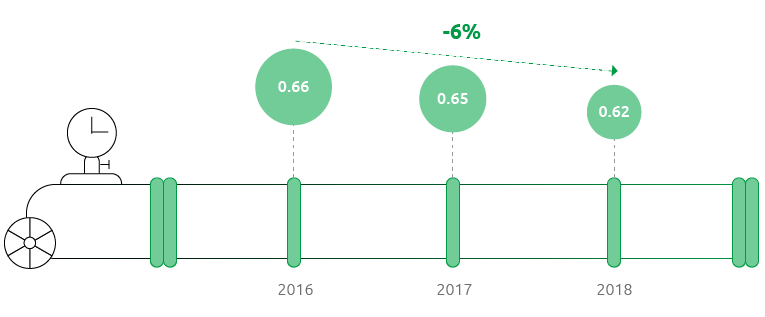
The methane emissions per kilometre of transportation network decreased by a further 4.3% compared to 2017 and by 6% compared with 2016.
Natural gas emissions (Mm3)
Direct GHG emissions - scope 1 (kt CO2eq)
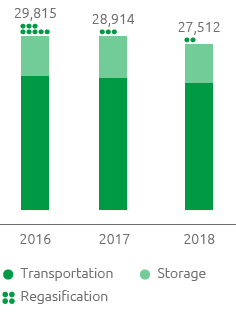
Methane emissions (t)
Methane emissions /km network (t/km)
| Download XLS (19 kB) |
KPI name |
KPI date |
Set target |
Target achieved in 2018 |
Sector |
Activity |
||||
|
|||||||||
Natural gas recovered over total potential emissions from maintenance activities |
2017 |
Recover at least 33% every year (up to 2022) |
56% |
Transportation |
|
||||
Limit natural-gas emissions (*) |
2018 |
Reduce 2022 emissions by -15% and 2025 emissions by -25% compared with 2016, excluding emergencies |
-7.9% |
Transportation, Storage, Regasification |
|
||||
3 The CO2eq was assessed in accordance with the instructions of the most recent Intergovernmental Panel on Climate Change (IPCC) “Fifth Assessment IPCC Reports” that assigned methane a Global Warming Potential (GWP) of 28.