Snam’s presence in the national and international infrastructure system
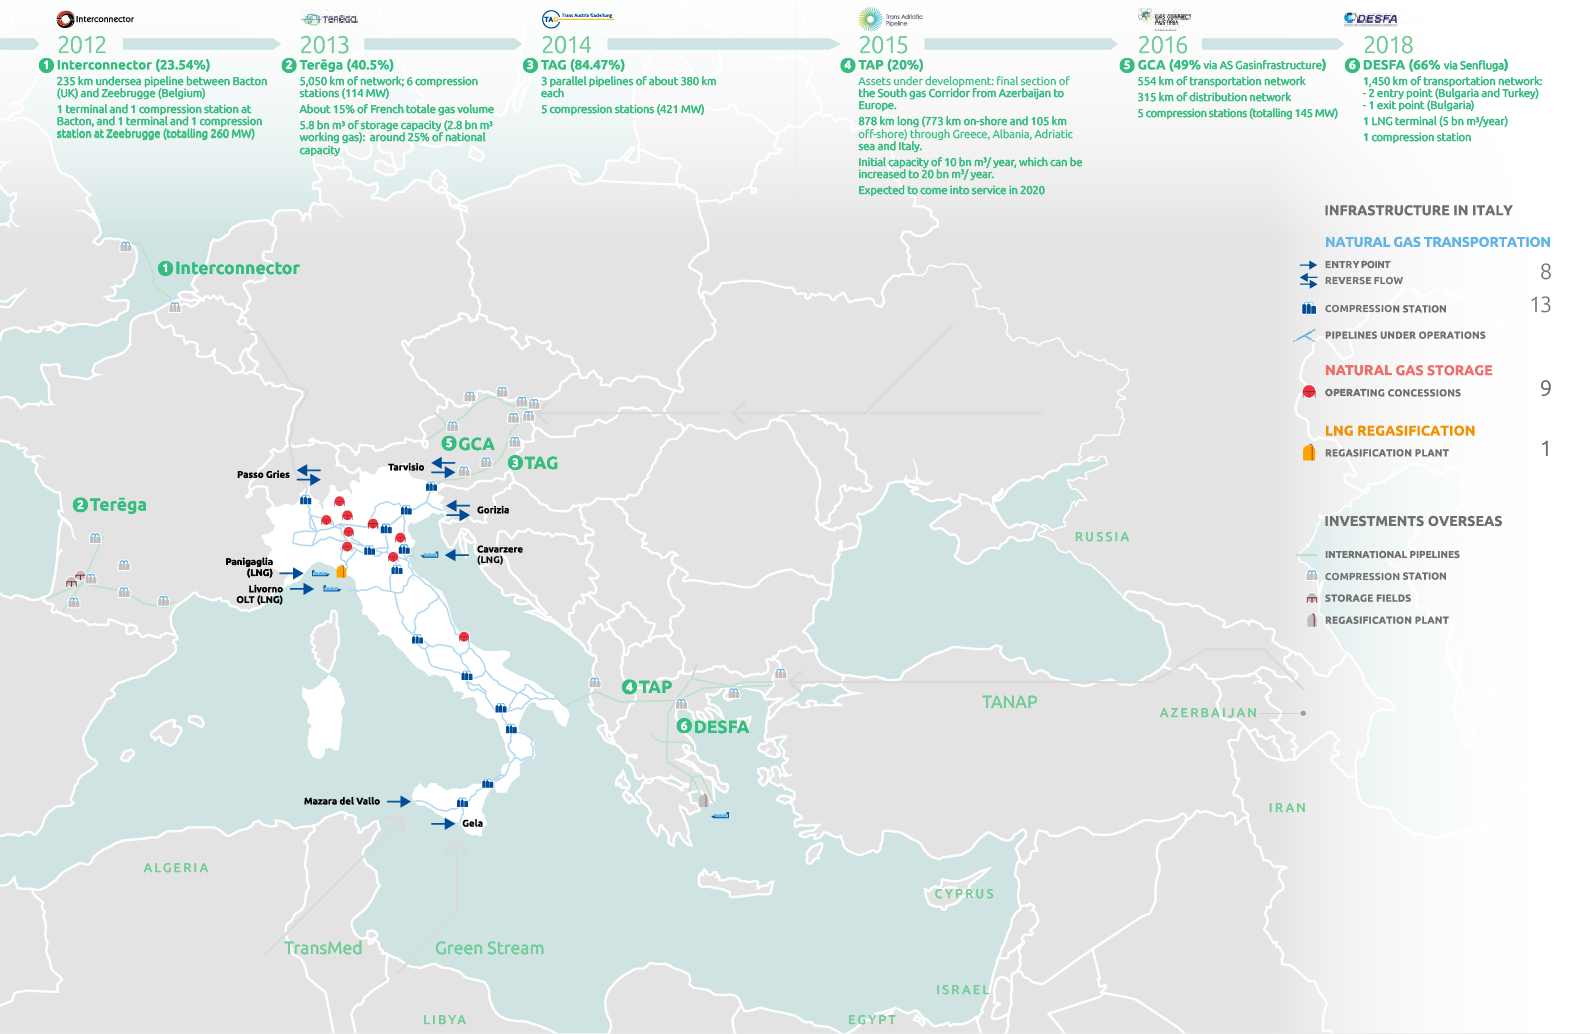
Snam’s international growth aims to consolidate the European infrastructure system facilitating the alignment between the consumer and producer interests, promoting a greater liquidity in the South-European gas market also through the development of new routes, and preserving the connection between the United Kingdom and continental Europe.
On 20 December 2018, the European consortium composed of Snam (60%), Enagás (20%) and Fluxys (20%) concluded the purchase, through the newly established Senfluga Energy Infrastructure Holding, of a 66% stake in DESFA, the greek national operator in the sector of natural gas infrastructure. Greece, an important crossroads for the diversification of procurement and the opening of new natural gas routes in Europe, has further development potential as a south-east European hub. The consortium, in addition to promoting innovation in the natural gas sector in Greece, will also encourage the introduction of renewable gases like biomethane to create a sustainable energy solution and actively contribute to the reduction of greenhouses gases and pollutant emissions in the country.
The national infrastructure
Snam is the leading Italian natural gas transportation and dispatching operator, and owns almost all of the transportation infrastructure in Italy, with 32,625 km of high- and medium-pressure gas pipelines (approximately 93% of the entire transportation system).
Snam’s presence in the national and international infrastructure system
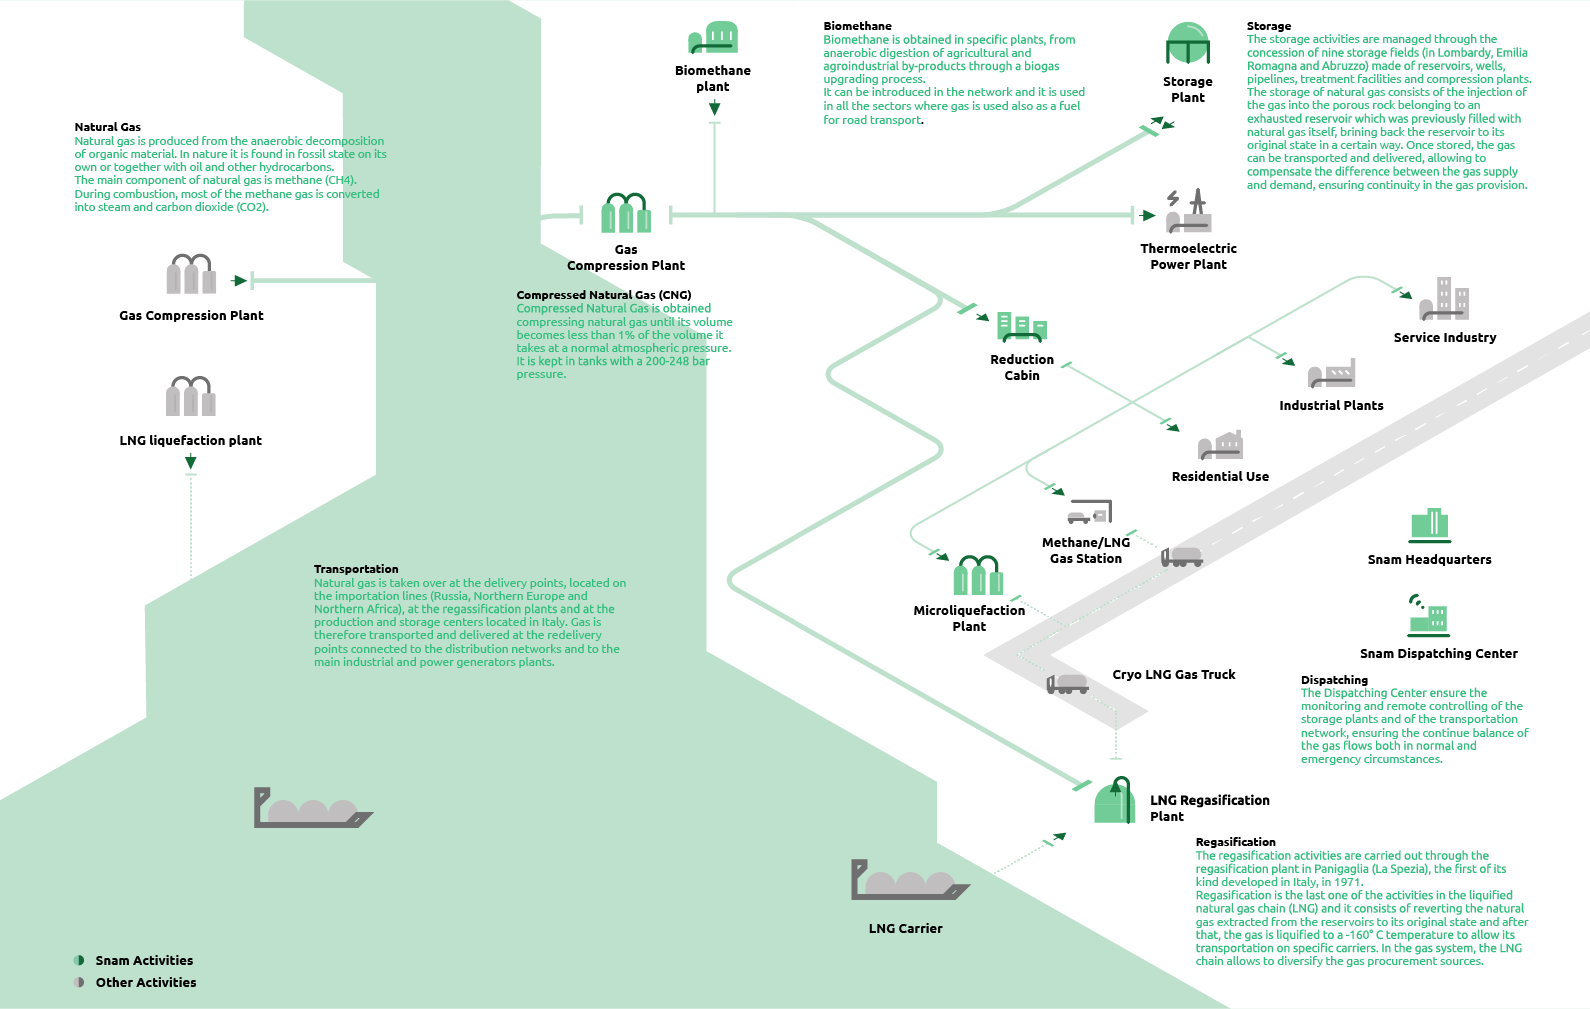
A world running on gas and the role of Snam
| Download XLS (19 kB) |
Operational Data |
Unit |
2016 |
2017 |
2018 |
Var. % |
Transportation |
|
|
|
|
|
Pipelines network |
km |
32,508 |
32,584 |
32,625 |
0.1 |
of which national pipelines network |
km |
9,590 |
9,704 |
9,697 |
(0.1) |
of which regional pipelines network |
km |
22,918 |
22,880 |
22,928 |
0.2 |
Natural gas injected in the network |
Bn m3 |
70.64 |
74.59 |
72.82 |
(2.4) |
of which imported |
Bn m3 |
65.07 |
69.35 |
67.70 |
(2.4) |
of which national production |
Bn m3 |
5.57 |
5.24 |
5.12 |
(2.3) |
Power installed in the compression stations |
(MW) |
922 |
902 |
961 |
4.2 |
Storage |
|
|
|
|
|
Gas moved in the storage reservoirs |
Bn m3 |
20.00 |
19.92 |
21.07 |
5.8 |
of which inputted in the reservoirs |
Bn m3 |
9.96 |
9.80 |
10.64 |
8.6 |
of which delivered from the resevoirs |
Bn m3 |
10.04 |
10.12 |
10.43 |
3.1 |
Total storage capacity |
Bn m3 |
16.5 |
16.7 |
16.9 |
0.9 |
of which available |
Bn m3 |
12.0 |
12.2 |
12.5 |
1.2 |
of which strategic |
Bn m3 |
4.5 |
4.5 |
4.5 |
– |
Regasification |
|
|
|
|
|
Regasified Gas |
Bn m3 |
0.21 |
0.63 |
0.91 |
44.4 |
Number of unloaded LNG carriers |
no. |
5 |
15 |
21 |
40 |
Maximum daily regasification capacity |
m3 |
17,500 |
17,500 |
17,500 |
– |
Employees |
|
|
|
|
|
Employees in service at year end |
no. |
2,883 |
2,919 |
3,016 |
3.3 |
of which Transportation |
no. |
1,726 |
1,972 |
1,915 |
(2.9) |
of which Storage |
no. |
301 |
60 |
59 |
(1.7) |
of which Regasification |
no. |
71 |
63 |
64 |
1.6 |
of which Corporate and other activities |
no. |
785 |
824 |
978 |
18.7 |