Other CO2eq energy emissions (Scope 3)
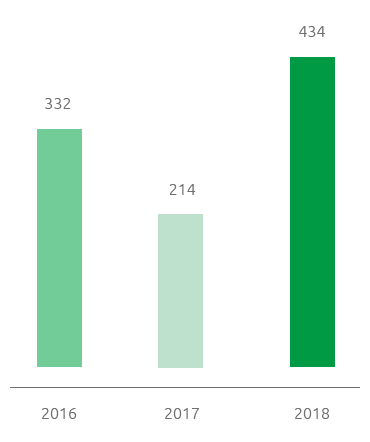
Indirect Scope 3 emissions in 2018 stood at around 438,000 tonnes of CO2eq, up compared with 2017 figures (217,000 tCO2eq) and they refer for the 99% to the supply chain emissions and for the remaining part to the employees’ commute to work and business trips.
The supply chain emissions were calculated by applying a method developed by a leading international company in the field of the Carbon Footprint analysis. The considerable increase in emissions compared to 2017 is mainly due to a substantial increase in the procurement activities (+80%) and to the different types of procured goods and services.
Indirect GHG emissions
scope 3 (kt CO2eq)

Supply Chain indirect GHG emissions
scope 3 (kt CO2eq)