Key income statement figures1
Adjusted EBIT (€ Mn)
Due to the soundness of operational management and rigorous financial discipline, Snam achieved very positive results in 2018. Adjusted EBIT amounted to €1,405 million, up €42 million (3.1%) compared with the 2017 value. The greater revenues (+€87 million, +3.6%) were mainly due to the gas transportation activities.
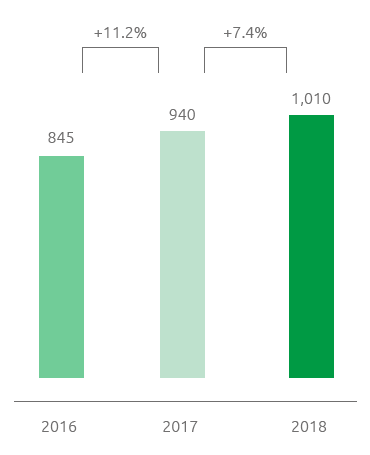
Adjusted net profit reached €1,010 million, up €70 million (+7.4%) compared with the 2017 adjusted net profit. In addition to the greater EBIT (+€42 million, +3.1%), the increase was due to the lower net financial expenditures (+€32 million, equal to the 14.1%), thanks to the reduction in the average costs of borrowing, also due to the benefits from the optimisation actions implemented in 2016 and, namely, the liability management operations and the greater net income from equity investments (+€9 million, +6.0%). These were partly offset by lower income taxes (-€13 million; 3.8%), mainly due to the reduction in the pre-tax profit.
Net financial debt was €11,548 million as at 31 December 2018, compared with €11,550 million as at 31 December 2017.
Added value produced and distributed
The Company produces wealth contributing to the economic growth of the society and the environment in which it operates, and it measures this wealth in terms of added value produced and distributed to its key stakeholders.
In 2018, the gross global added value produced by Snam was €2,532 million: an increase of €85 million or 3.5% compared with 2017 (€2,447 million).
| Download XLS (17 kB) |
(€ million) |
2016 |
2017 |
2018 |
||
|
|||||
Added value produced (A) |
2,518 |
2,447 |
2,532 |
||
Added value distributed (B) |
1,913 |
1,621 |
1,634 |
||
Employees |
260 |
249 |
280 |
||
Local communities: donations and sponsorships, statutory environmental compensation |
3 |
5 |
3 |
||
Lenders (Bondholders and Banks) |
610 |
292 |
249 |
||
Shareholders |
718 |
732 |
746 |
||
Government |
323 |
343 |
356 |
||
Direct taxes |
308 |
329 |
341 |
||
Indirect taxes |
15 |
14 |
15 |
||
Added value retained by the Company (A) – (B) |
605 |
826 |
898 |
||
Distribution of added value (%)
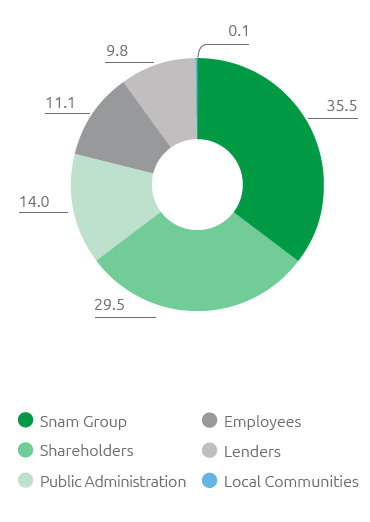
Referring to the main stakeholders, the Added Value was distributed as follows:
- Employees 11.1% (+0.9 percentage points compared to 2017) as direct compensation consisting of wages, salaries and severance pay and indirect compensation consisting of social security contributions and staff-related service costs (canteen services, reimbursement of travel expenses);
- Government 14.0% (percentage stable compared to 2017) – through the payment of direct and indirect taxes;
- Shareholders 29.5% (-0.4 percentage points compared to 2017) – through distributed dividends. With a rising unit dividend (+5% compared to 2017) confirming Snam’s commitment to guaranteeing an attractive and sustainable remuneration for shareholders, there was a reduction in the number of outstanding shares following the buyback of shares under the scope of the share buyback programme.
- Lenders 9.8% (-2.1 percentage points compared to 2017). Reduction in response to the benefits arising from optimising activities implemented during 2016 and 2017, in particular the liability management operations, in spite of the increased average debt in the period.
A total of 35.5% of the gross global added value produced by Snam was reinvested within the Group (up compared with 2017: +1.7 percentage points), of which around 77% was intended for the amortisation and depreciation of the infrastructure used in the production process (80% in 2017).
Lastly, approximately €3 million was designated for local communities (0.1% of the generated value) through donations, sponsorship initiatives and environmental compensation pursuant to the law.
1 See Financial Report for greater details