Operating performance and operating and financial results
|
OPERATING PERFORMANCE |
|
|
|
|
|
|
Activities |
|
Transportation |
In 2014 62.28 billion cubic metres of gas were injected into the transportation network, a reduction of 6.72 billion cubic metres (−9.7%) compared to 2013. The decline was mainly due to the reduction in demand for natural gas in Italy (−11.6% compared to 2013). The reduction was also due to lower consumption in the residential and service sectors (−17.0%) due largely to climate conditions, and the thermoelectric sector (−14.0%) as a result of shrinking demand for electricity and the concurrent growth in the production of energy from renewable sources (especially hydroelectric and photovoltaic sources). |
|
Regasification |
The LNG terminal in Panigaglia (SP) regasified 0.01 billion cubic metres of natural gas (0.05 billion cubic metres in 2013). Regasification volume was affected by the ongoing gas consumption crisis in Europe and the general trend in demand for LNG at the global level that resulted in strong demand, especially in Far Eastern markets to the detriment of the European market. |
|
Storage |
The volume of gas moving into the storage system in 2014 totalled 15.70 billion cubic metres, a reduction of 2.72 billion cubic metres (−14.8%) compared to 2013. The reduction was due to lower distributions from storage (−20.3%) attributable to milder temperatures in the first quarter of the year than the corresponding period of the previous year. As at 31 December 2014, total storage capacity, including strategic storage, was 15.9 billion cubic metres (unchanged from the level at 31 December 2013), of which 11.4 billion cubic metres were for available storage capacity, which was totally allocated for thermal year 2014-2015, and 4.5 billion cubic metres for strategic storage (unchanged compared to thermal year 2013-2014). |
|
Distribution |
In 2014 6,500 million cubic metres of gas were distributed representing a reduction of 852 million cubic metres (−11.6%) compared to 2013 due primarily to the climate effect. At year end Snam was the concessionaire of the gas distribution service in 1,437 municipalities (1,435 in 2013), of which 1,361 are in operation and 76 have networks to be completed and/or built (91 in 2013), with 6.408 million active meters (5.928 million in 2013) located at points where gas is redelivered to end customers (households, businesses, etc.). As at 31 December 2014, the gas distribution network was 55,278 km long (52,993 km long in 2013), an increase of 2,285 km. Operating performance reflects the contribution of Italgas’s acquisition of A.E.S., a company that directly manages the natural gas distribution service in the city of Turin with a network of 1,337 km of pipelines, 465,668 active redelivery points and 54 million cubic metres carried in 2014. |
On 11 July 2014 the Court of Palermo notified the subsidiary Italgas of the asset-related precautionary measure of the judicial administration pursuant to Art. 34, paragraph 2, of Legislative Decree 159/2011 (Code of anti-mafia laws and precautionary measures as well as new provisions concerning anti-mafia documentation in accordance with Articles 1 and 2 of Law 136 of 13 August 2010). By law, the measure aims to protect Italgas’s assets from any infiltrations and/or collusion.
Information on developments related to the measure notified to Italgas are provided in Note 24, “Guarantees, commitments and risks – Other measures” in the notes to the consolidated financial statements.
Regulation of tariffs
The clarity, stability and transparency of the regulatory framework for determining revenue and tariffs are key factors for the Company’s economic sustainability, and are also important to gas system operators, who are affected by costs associated with infrastructure use, and to financial investors, in terms of predicting returns on their investments.
In general, tariff criteria are defined every four years (6 years for distribution).
The revenues from all activities are determined so as to ensure coverage of operating costs, depreciation and amortisation, and a fair return on net invested capital. Incentives are also provided, differentiated according to the type of investments made during the course of each regulatory period. Every year, based on its own recorded revenue, each Snam company formulates a tariff proposal which is submitted to Authority for approval.
| Download XLS (22 kB) |
|
Regulatory periods |
|
|
|
SNAM RETE GAS |
January 2014 |
December 2017 |
|
GNL ITALIA |
October 2014 |
December 2017 |
|
ITALGAS |
January 2014 |
December 2019 |
|
STOGIT |
January 2015 |
December 2018 |
Investments
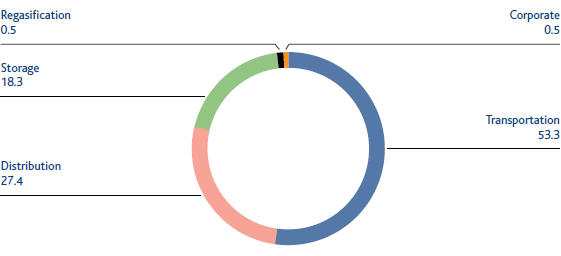
Capital expenditures continued to be strong in 2014 totalling €1,313 million (€1,290 million in 2013).
TECHNICAL INVESTMENTS BY ACTIVITY (%)

Of the €700 million invested in transportation, €211 million was allocated to support the market in the north-western area of the country and to make possible the reversal of physical transportation flows at interconnection points with northern Europe, and €85 million was invested in projects to expand the transportation network from entry points in southern Italy.
By contrast, €240 million was invested in storage, primarily for the development of the Settala, Bordolano and Fiume Treste fields and for the repowering of the Minerbio field and €359 million was invested in distribution, mainly involving development initiatives (extensions and new networks) and the upgrading of existing networks including through the replacement of cast iron pipelines. Lastly, €7 million was invested to ensure the safety and efficiency of the regasification plant.
Operating and financial results*
In 2014 Snam reported satisfactory results with gross operating profit (EBITDA) of €2.8 billion and operating income (EBIT) of about €2.0 billion, which was in line with the corresponding amounts for 2013.
Net profit totalled €1.2 billion, an increase of €0.3 billion (+30.6%) compared to 2013. The increase was mainly due to the decrease in income tax and the improvement in financial operations, and was partly the result of the contribution from assets acquired as a part of the business development strategy. In particular, the reduction in taxes, despite the increase in profit before taxes, was mainly due to the impact of the deferred tax adjustment resulting from the additional IRES (so-called “Robin Hood Tax”) being declared unconstitutional effective 12 February 2015.
Adjusted net profit, which excludes the positive impact of the adjustment of deferred taxes, totalled €1.1 billion, an increase of 15.4% compared to the corresponding 2013 amount.
Positive cash flow of €1.5 billion from operating activities made it possible to fully fund financial requirements connected with net investments and to generate free cash flow of €0.3 billion. Following payment of a dividend to shareholders of €0.5 billion, net financial debt amounted to €13.6 billion, an increase of €0.3 billion compared with 31 December 2013.
* See Annual Report for additional details
Distribution of added value
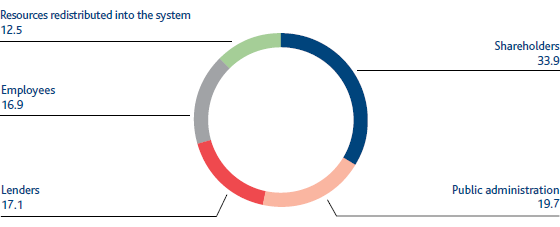
In 2014 Snam distributed total value of €2,261 million to its stakeholders against added value produced (€2,584 million).
Of this amount, 33.9% was paid out to shareholders (€875 million), 19.7% to the government (€509 million), 17.1% to lenders (€441 million) and 16.9% to employees (€436 million). The remaining 12.5% (€323 million) was reinjected into the system.
The net overall added value was therefore distributed among different beneficiaries as follows: (i) employees (direct compensation comprising salaries, wages and post-employment benefits, and indirect compensation consisting of social security expenses, as well as costs for staff services (meal services, travel expense reimbursement, etc.); (ii) government (income tax); (iii) lenders (interest on loan principal disbursements); (iv) shareholders (dividends distributed).
| Download XLS (23 kB) |
|
TOTAL ADDED VALUE GRI – G4: EC1 |
|||||
|
|
|
|
|
||
|
|
2012 |
2013 |
2014 |
||
|
|||||
|
Core business revenue |
3,730 |
3,735 |
3,784 |
||
|
Other revenue and income |
216 |
113 |
98 |
||
|
Purchases, services and sundry expenses * |
760 |
644 |
733 |
||
|
Net financial expense |
431 |
17 |
(7) |
||
|
Net income from equity investments |
55 |
45 |
131 |
||
|
Increases on internal works – Cost of work and financial expenses |
91 |
94 |
100 |
||
|
Gross total added value |
2,901 |
3,326 |
3,387 |
||
|
less – Amortisation, depreciation and impairment losses |
706 |
769 |
803 |
||
|
Net total added value |
2,195 |
2,557 |
2,584 |
||
DISTRIBUTION OF ADDED VALUE (%)

Performance of Snam shares
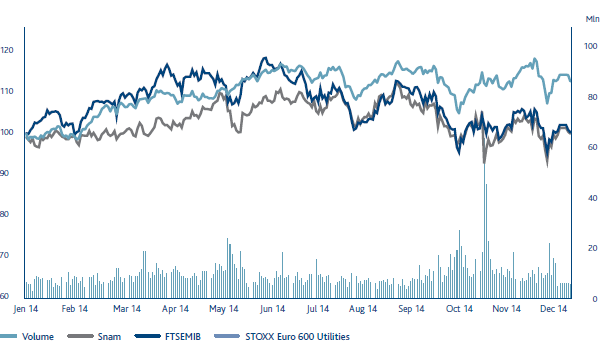
Snam’s stock, which is included in the FTSE MIB Italian index as well as leading international indices (STOXX, Europe 600 and STOXX Europe Utilities) and in major sustainability indices, ended 2014 at an official price of €4.11, up by 1.9% compared with €4.04 at the end of the previous year. The stock benefited from positive stock market performance and the positive assessment of the strategic plan and quarterly results of the Group.
A further source of support was investors’ preference for stocks with a high return that are more defensive against the backdrop of a downward revision of growth estimates for the European economy. At the end of the year, prices came down gradually due to the overall decline in stock prices and a greater perception of regulatory risk. Around 2.6 billion Snam shares were traded on the electronic segment of the Italian stock exchange in 2014, with the average daily trading volume in line with the previous year at 10.2 million shares.
SNAM LISTINGS ON FTSE MIB AND EURO STOXX UTILITIES
Since listing on the stock exchange in 2001, Snam has always aimed to be transparent in its relations with the financial community by expressly communicating its objectives and the results it has achieved. In order to sustain the quality of these strong relations, benchmark best practices are adopted each year to allow shareholders and the financial market to fully evaluate the Company’s levers for creating value. These include:
- roadshows (20 in 2014) aimed at meeting shareholders and institutional investors in the largest European and North American financial markets;
- sector conferences (five in 2014), which enable investors specialising in the utilities and infrastructure sector to meet the Company’s top managers;
- one-to-one meetings between management and investors (108 in 2014), in addition to numerous group meetings (32 in 2014);
- conference calls when the company’s (annual, semi-annual and quarterly) results are published and when the Strategic Plan is presented.
In 2014 a “Site Visit/Investor Day” was held for a foreign delegation interested in obtaining direct knowledge of the most significant areas of the Group’s operating excellence.
During the year, there was also a significant amount of communication with Snam’s bond investors and with credit market analysts, through management’s participation in dedicated conferences (two in 2014) and a large number of one-to-one meetings and conference calls.
The Company also continued to communicate with ratings agencies Standard & Poor’s and Moody’s and maintained an investment grade credit rating of Baa1 with Moody’s, while Standard & Poor’s adjusted its rating in December 2014 to BBB reflecting the Company’s structure and financial strength.
| Download XLS (29 kB) |
|
KEY PERFORMANCE INDICATORS (KPI) GRI – G4: 27 |
|||||
|
|
|
|
|
|
|
|
KPI description |
KPI date |
Pre-set target |
Target achieved in 2014 |
Sector |
Status Activities |
|
Meetings with socially responsible investors as a % of total meetings |
2010 |
Achieve 33% in 2014 |
39 |
Snam Group |
|
|
Number of meetings with institutional investors |
2010 |
Hold 240 in 2014 |
259 |
Snam Group |
|
|
Number of Investor Days/site visits (no.) |
2010 |
Hold 1 during the year |
1 |
Snam Group |
|
|
|
|
||||
Information of interest to shareholders and investors both in Italian and in English, is available in the Investor Relations section on the Company website, www.snam.it.
The same section makes several periodic publications available such as “Financial Markets Reviews”, which offers a monthly analysis of Snam stock and the stocks of other competitors in financial markets and their stock market performance in the utility sector, “News&Facts”, a quarterly publication targeting primarily individual investors and the “Shareholder Guide”, also available in interactive form, which is updated every six months and aims at providing a summary of information useful for all shareholders to actively experience their Snam investment.
Last year the publication “Sustainability, Creating Shared Value” was added; this is an annual document that summarises the sustainability policies behind Snam’s choices and initiatives in its relations with stakeholders. Finally, since December 2014 the new publication, CSR Review, has been available; this is a newsletter that provides in-depth coverage of Corporate Social Responsibility.
