Protecting the climate GRI - G4: EN7, EN16, EN17, EN2
Greenhouse gases
The greenhouse gases (GHG) emitted into the atmosphere by the activities of Snam are carbon dioxide (CO2) and methane (CH4), the main component of natural gas. The CO2 is a by-product of the combustion process and is directly associated with the consumption of fuels, while the emissions of natural gas, and therefore CH4, derive partly from the normal operation of the plants and partly from the atmospheric emissions due to the connection of new and maintenance pipelines or to accidental events of the transportation and distribution networks.
In addition to using natural gas as its main fuel, Snam is implementing a series of energy management activities in order to minimise GHG emissions in its operating activities by employing specific containment programmes.
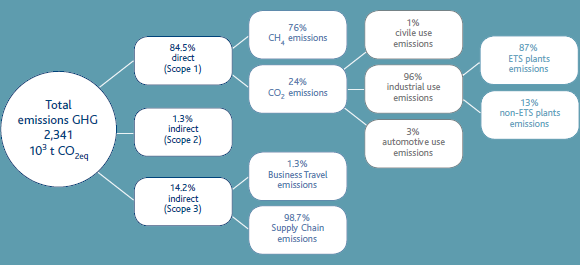
In 2014, total GHG emissions (direct Scope 1, and indirect Scope 2 and Scope 3) were approximately 2.34 million tonnes (−9% from 2013).
TOTAL GHG EMISSIONS - SCOPE 1-2-3 (103t)

GREENHOUSE GASES - SNAM GROUP
The advantages of natural gas
At equal energy usage, the carbon dioxide produced by the combustion of natural gas is 25-30% less than petroleum products and 40-50% less than coal. The decrease in emissions per unit of energy produced is further accentuated by the possibility of using natural gas in high-performance applications and technologies, such as condensation boilers, co-generation plants and combined cycles for producing electricity. A gas-powered combined cycle with an output of 56-58%, compared with an output of about 40% from traditional steam-powered cycles, makes it possible to reduce CO2 emissions by 52% compared with a traditional fuel oil-powered plant and by 62% compared with a coal-powered plant.
| Download XLS (25 kB) |
|
TYPICAL GAS COMPOSITION INJECTED INTO THE TRANSPORTATION NETWORK 2014 – AVERAGE VALUES |
|||||||||||
|
|
|
|
|
|
|
|
|
|
|
||
|
Composition |
Unit of mea- |
Tarvisio Importation (Russian Gas) |
Passo Gries Importation (Northern Europa) |
Mazara del Vallo Importation (Algerian Gas) |
Gela Importation (Libyan Gas) |
Panigaglia Importation (LNG) |
Ravenna Terra Entry (National Gas) |
Falconara Entry (National Gas) |
Edison Minerbio LNG interconnect. |
||
|
|||||||||||
|
Methane |
%MOLE |
95.778 |
89.718 |
85.435 |
85.015 |
98.448 |
99.629 |
99.428 |
92.998 |
||
|
Ethane |
%MOLE |
2.355 |
4.398 |
9.373 |
6.223 |
0.878 |
0.060 |
0.016 |
6.625 |
||
|
Propane |
%MOLE |
0.552 |
0.831 |
1.406 |
2.176 |
0.091 |
0.011 |
0.002 |
0.087 |
||
|
Isobutane |
%MOLE |
0.086 |
0.131 |
0.119 |
0.306 |
0.006 |
0.005 |
0.002 |
0.004 |
||
|
Normal Butane |
%MOLE |
0.087 |
0.137 |
0.154 |
0.480 |
0.007 |
0.001 |
0.002 |
0.005 |
||
|
Isopentane |
%MOLE |
0.019 |
0.040 |
0.028 |
0.126 |
0.004 |
0.004 |
0.003 |
0.003 |
||
|
Normal Pentane |
%MOLE |
0.015 |
0.030 |
0.023 |
0.081 |
0.000 |
0.004 |
0.003 |
0.003 |
||
|
Hexanes + |
%MOLE |
0.011 |
0.039 |
0.031 |
0.022 |
0.000 |
0.000 |
0.000 |
0.000 |
||
|
Nitrogen |
%MOLE |
0.721 |
3.224 |
1.616 |
4.097 |
0.537 |
0.237 |
0.472 |
0.250 |
||
|
Carbon dioxide |
%MOLE |
0.354 |
1.418 |
1.791 |
1.359 |
0.000 |
0.049 |
0.072 |
0.001 |
||
|
Helium |
%MOLE |
0.012 |
0.034 |
0.024 |
0.115 |
0.000 |
0.000 |
0.000 |
0.024 |
||
|
Oxygen |
%MOLE |
– |
– |
– |
– |
0.029 |
– |
– |
– |
||
|
|
|
|
|
|
|
|
|
|
|
||
|
Higher heating value |
kJ/m3 |
38,557 |
38,102 |
40,296 |
39,617 |
37,885 |
37-711 |
37,591 |
39,635 |
||
|
Lower heating value |
kJ/m3 |
34,753 |
34,373 |
36,405 |
35,797 |
34,120 |
33,953 |
33,845 |
35,750 |
||
Main measures in 2014 to contain greenhouse gas emissions ▷ GRI – G4: EN6
- Installation of more energy efficient turbines and more efficient heat generators
- Installation of photovoltaic systems on buildings and at network plants
- Use of LED lightbulbs to replace various traditional lights, and installation of automated luminous flux regulators to illuminate several external plant areas
- Natural gas recovery procedures (measures to recompress gas in the transportation network and in compression systems)
- Replacement of cast iron pipes in gas distribution networks
- Replacement of various pneumatic actuators fuelled by natural gas
- Purchase of electricity produced from renewable sources for certain sites with heavy energy consumption
- Installation of a system that equally distributes loads on reduction lines in certain gas regulation and measurement systems
- Restructuring of buildings to improve their energy ratings
- More rational use of air conditioning through the summer “no tie” initiative
CO2eq emissions avoided: 104,000 tons
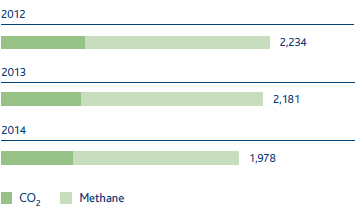
Direct CO2eq emissions (Scope1) GRI – G4: EN15, EN19
2014, direct CO2eq emissions were approximately 1.98 million tonnes (−9.3% compared with 2013). Direct CO2 emissions from combustion stood at approximately 478,320 tonnes (−23% compared to 2013), while CO2eq emissions deriving from methane emissions were approximately 1.5 million tonnes (−3.8% compared with 2013).
The CO2eq emissions were calculated based on a global warming potential (GWP) of 25 for methane, as indicated in the 2007 scientific study of the Intergovernmental Panel on Climate Change (IPCC), “IPCC Fourth Assessment Report”.
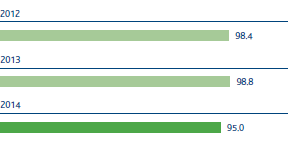
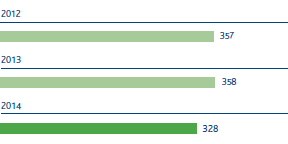
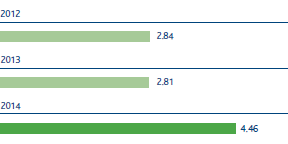
In 2014, the Group’s natural gas emissions were reduced compared with 2013, falling from 98.8 Mm3 to 95 Mm3 (−3.8%), also taking into account the contribution of the AES distribution network, accounted for as from July 2014. Without AES contribution, the emissions would decline by −4.6%.
DIRECT CO2eq EMISSIONS - SCOPE 1 (103t)
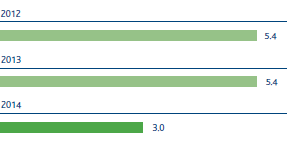
In order to contain natural gas emissions from the transportation network, activities were continued which involve gas recovery through online gas recompression measures in the network upgrading phase (3 million cubic metres of natural gas were recovered, representing approximately 47,700 tonnes of CO2eq), as well as the replacement of pneumatic equipment at some plants. As regards containing natural gas emissions in distribution networks, the Company continued to replace cast-iron piping with higher-performance piping (replacing about 79 km of networks).
NATURAL GAS EMISSIONS (106m3)
NATURAL GAS RECOVERED - transportation activity (106m3)
| Download XLS (30 kB) |
|
KEY PERFORMANCE INDICATORS (KPI) |
|||||||
|
|
|
|
|
|
|
||
|
KPI description |
KPI date |
Pre-set target |
Target achieved in 2014 |
Sector |
Status Activities |
||
|
|||||||
|
Natural gas recovered out of total potential emissions from maintenance activities |
2010 |
Recover 30% in 2014 |
37 |
Transportation |
|
||
|
Contain natural gas emissions in the transportation network |
2014 |
Keep annual emissions of natural gas below 1,240 m3/km until 2017 |
1,151 |
Transportation |
|
||
|
Replacement of cast-iron networks (km) |
2010 |
Replace the entire grey cast-iron network by 2015 * |
298 |
Distribution |
|
||
|
Contain natural gas emissions in the distribution network * |
2014 |
Reach emissions of natural gas of 790 m3/km in 2017 |
802 |
Distribution |
|
||
|
|
|
||||||
Indirect emissions (Scope 2) GRI – G4: EN16
Indirect CO2eq emissions arise from the use of electricity; in 2014 they made up approximately 31,470 tonnes.
With the contractual agreements executed in recent years, Snam has maintained the same number of plants fuelled by electricity produced from renewable sources, i.e., the Messina compression plant (Snam Rete Gas);
the Brugherio storage field (Stogit); and the Panigaglia regasification plant (GNL Italia). This operation, as well as the use of photovoltaic panels for power generation, enabled the avoidance of approximately 6,270 tonnes of CO2eq.
Indirect CO2eq emissions are calculated with a factor of 0.3853 kg CO2/kWh (as indicated in the Italian Greenhouse Gas inventory 1990-2012 – National Inventory Report 2014).
INDIRECT CO2eq EMISSIONS - SCOPE 2 (103t)

Indirect emissions (Scope 3) GRI – G4: EN17
Indirect Scope 3 emissions refer to CO2eq emissions related to the supply chain (goods, labour and services) and business travel (business trips, transfers of Snam’s employees as part of their working activities).
In 2014 emissions of CO2eq were about 333,000 tonnes (−7.9% compared with 2013). This figure was due to an increase in emissions from business travel (a higher number of km travelled by plane and train, due in part to the company’s European expansion) and a decrease in emissions in the supply chain.
INDIRECT EMISSIONS - SCOPE 3 - SUPPLY CHAIN (103t CO2)
INDIRECT EMISSIONS - SCOPE 3 - BUSINESS TRAVEL (103t CO2eq)
Indirect Scope 3 missions related to the supply chain were calculated by applying a methodology developed by a leading international company in the analysis of carbon footprints.
Emission Trading GRI – G4: EC2
The Snam plants falling under the scope of application of the Emissions Trading Directive as at 31/12/2014 are shown in the table:
| Download XLS (22 kB) |
|
IMPIANTI EMISSION TRADING GRUPPO SNAM |
||||
|
|
|
|
||
|
Activities |
No of plants |
Names of plants |
||
|
||||
|
Transportation |
11 |
Gas compression plants in Enna, Gallese, Istrana, Malborghetto, Masera, Melizzano, Messina, Montesano, Poggio Renatico, Tarsia, Terranuova and Bracciolini |
||
|
Storage |
7 |
Gas compression storage stations in Cortemaggiore, Fiume Treste, Minerbio, Ripalta, Sabbioncello, Sergnano and Settala |
||
|
Regasification |
1 |
Liquefied natural gas regasification plant in Panigaglia |
||
CO2 EMISSIONS (106t)
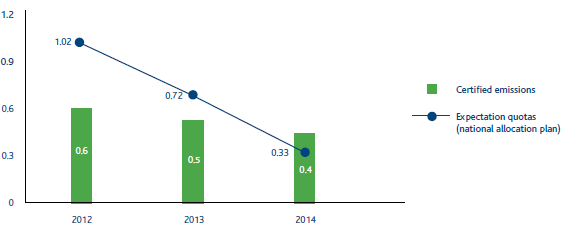
With the launch of the third regulation period (2013-2020), the system for authorising the emission of greenhouse gas, which was regulated in the past by Legislative Decree 216/2006, was updated and amended by Legislative Decree No. 30 of 13 March 2013, in effect since 5 April 2013. According the new provisions, the main goal of the decree was to update regulations concerning authorisations to emit greenhouse gas and to constantly reduce the shares of emissions released free of charge. Shares assigned to each plant will be at gradually decreasing allotments and no longer constant (as in the second regulation period), and will also depend on the actual operation of the plants.
In 2014, total CO2 emissions issued by the Snam Group and certified by an accredited body, according to the provisions of the competent national authority, amounted to 0.4 million tonnes, out of a total of 0.33 million annual shares currently being assigned by the Ministry for the Environment, Land and Sea (negative balance of 0.067 million shares). This deficit is fully offset by shares already in the registers of individual plants accumulated due to prior year surpluses.
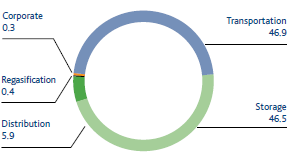
Energy consumption GRI – G4: EN3, EN6
The Group’s main energy consumption is due to the gas turbines used in compression stations to provide gas with the pressure necessary for transportation (compression consumption) or storage (storage consumption).
To limit energy consumption, the best available technologies have always been used and high-performance turbines have been installed. In particular, the fuel consumption of the compression stations is controlled by the dispatching unit through the use of software systems that make it possible to manage the transportation network as efficiently as possible, in keeping with transportation and storage needs, with an optimal configuration of the individual plants.
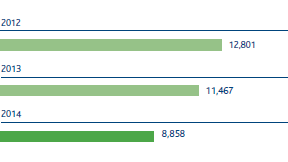
In 2014 total energy consumption was about 8,858 TJ, a reduction of 22.8% compared with 2013. The reduction was due to the decrease in gas transportation activity (−9.7% compared with 2013) and various transportation conditions resulting in increased quantities of gas from northern Europe (+52.6% compared with 2013), and at the same time, a decrease in the quantity of gas injected by North Africa (−26.8%) and Russia (−13.6%) and regasification plants (−20%).
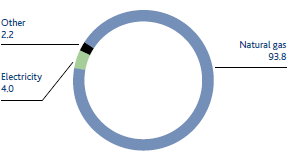
The energy source most used was natural gas, which covered 93.8% of total energy requirements. The other sources used were electricity (4%) and other fuels (diesel oil, petrol, LPG) and heat which together total 2.2%.
ENERGY CONSUMPTION (TJ)
ENERGY CONSUMPTION BY ACTIVITY (%)
ENERGY CONSUMPTION BY SOURCE (%)
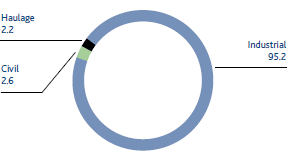
ENERGY CONSUMPTION BY USE (%)
In the area of Energy Management, the Company continued to streamline and lower energy consumption through activities such as improving the energy efficiency of the gas powered turbines, installing photovoltaic systems in buildings and network plants, adopting LED lightbulbs and automated regulators for lighting plants, and installing more efficient heat generators.
Energy consumption was determined for various fuels in accordance with the coefficients specified in the emissions trading directive.
Production and use of energy from renewable sources GRI – G4: EN6
The Company, aware of the importance of using energy from renewable sources, launched plans entailing the installation of photovoltaic plants at property sites (local sites and maintenance centres) and at some distribution network plants for the collection and reduction of natural gas pressure.
| Download XLS (23 kB) |
|
RENEWABLE ENERGY PLANTS OF THE SNAM GROUP |
|||||||||||
|
|
|
|
|
|
|
|
|
|
|
||
|
|
2012 |
2013 |
2014 |
||||||||
|
Type |
(no.) |
Total Power (kW) |
Energy Produced (kWh) |
(no.) |
Total Power (kW) |
Energy Produced (kWh) |
(no.) |
Total Power (kW) |
Energy Produced (kWh) |
||
|
|||||||||||
|
Wind Generators |
1 |
1.5 |
143,542 |
1 |
1.5 |
202,259 |
1 |
1.5 |
477,213 |
||
|
Photovoltaic Systems |
1,699 |
454.6 |
802 |
478.5 |
951 |
611.5 |
|||||
|
Total |
1,700 |
466.1 |
803 |
480 |
952* |
613 |
|||||
At the end of the year, the power installed at renewable energy plants of the Snam group increased by 133 kW compared with 2013, from 480 kW to 613 kW (+28%) an increase essentially due to the new photovoltaic systems connected to the network during the year. The total number of plants increased from 803 to 952 units (+19%), an increase essentially due to the new back-up plants for monitoring gas redelivery point plants.
The total energy produced by renewable energy plants increased significantly compared to 2013, rising from 202,000 kWh in 2013 to 477,000 kWh in 2014 (+136%). Said increase is due both to the new plants installed in 2014 and to the connection of plants installed in previous years and that had not yet been connected to the network.
Performance Indicators
With the full achievement of the goal set (“making 85% of units installed in the storage segment highly efficient”), all the energy-related goals set in 2010 have been accomplished a year in advance.
| Download XLS (28 kB) |
|
KEY PERFORMANCE INDICATORS (KPI) |
|||||
|
|
|
|
|
|
|
|
KPI description |
KPI date |
Pre-set target |
Target achieved in 2014 |
Sector |
Status Activities |
|
High-efficiency turbines |
2010 |
Achieve 85% out of total units installed by 2015 |
88.9 |
Storage |
|
|
|
|
||||
During the year, new performance indicators were established for various company sectors to continue the monitoring of initiatives implemented as a part of Energy Management activities, and the following goals were set:
| Download XLS (31 kB) |
|
KEY PERFORMANCE INDICATORS (KPI) GRI – G4: EN6, EN7 |
|||||
|
|
|
|
|
|
|
|
KPI description |
KPI date |
Pre-set target |
Target achieved in 2014 |
Sector |
Status Activities |
|
Photovoltaic systems |
2014 |
Install capacity of 40 kW by 2015 Produce 40,000 kWh/ |
– – |
Storage |
|
|
Photovoltaic systems |
2014 |
Install capacity of 370 kW by 2016 Produce 260,000 kWh/ |
197 kW 142,000 kWh |
Transportation |
|
|
Photovoltaic systems |
2014 |
Install capacity of 170 kW by 2017 Produce 120,000 kWh/ |
5 kW 3,200 kWh |
Distribution |
|
|
High efficiency heat generators in R&R stations |
2014 |
Install capacity of 30 MW by 2017 |
11 MW |
Transportation |
|
|
Turboexpander in R&R stations |
2014 |
Install one system by 2017 Produce 4,000,000 kWh/ |
– – |
Distribution |
|
|
Load distribution systems in R&R stations |
2014 |
Install 26 systems by 2017 Save 150,000 m3/ |
4 16,000 m3 |
Distribution |
|
|
Installation of LED systems in R&R stations |
2014 |
Install 40 systems by 2017 |
– |
Distribution |
|
|
Energy class B buildings |
2014 |
Upgrade 8 buildings from energy class E to B by 2017 Save 50,000 m3/ |
4 30,000 m3 |
Storage |
|
|
|
|
||||
Air protection GRI – G4: EN21
The use of natural gas as its principal energy source enables the Company to minimise emissions of sulphur oxides and particulate matter.
Nitrogen oxide (NOx) emissions, the only significant polluting emissions, arise from the combustion of natural gas in the gas turbines installed in the compression stations (compression and storage).
To reduce these emissions, a programme was established several years ago to modify several existing turbines and install new units with low emission combustion (DLE) systems.
Specifically, in 2014, the DLE turbocompressors were put into service at the Messina (TC2), Enna (TC6), Cortemaggiore (TC3) and Minerbio (TC4) plants. During the same year, the four gas pre-heating boilers, which were installed at the entry point plant at Mazara del Vallo, were replaced with more efficient heat generators.
TOTAL NOx EMISSIONS (t)
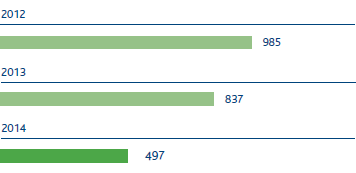
In 2014 total emissions of nitrogen oxides were around 497 tonnes (−41% compared with 2013). The decrease was mainly due to two factors: the reduction in fuel gas for the operation of gas turbines in compression stations, and increased use of DLE turbines. In the transportation sector, DLE turbines were used for 87% of total operating hours.
NOx emissions into the atmosphere were determined based on direct measurements or, if these were not available, on emission factors present in the relevant literature (the EMEP/EEA Air Pollutant Emission Inventory Guidebook of the European Environment Agency).
The table shows the goals for reducing nitrogen oxide emissions that had been set in 2010 using key performance indicators with a quantitative target. In 2014, three of the four targets set were achieved one year in advance.
| Download XLS (30 kB) |
|
KEY PERFORMANCE INDICATORS (KPI) |
|||||
|
|
|
|
|
|
|
|
KPI description |
KPI date |
Pre-set target |
Target achieved in 2014 |
Sector |
Status Activities |
|
No. of DLE turbines out of total no of turbines |
2010 |
Achieve 75% by 2015 |
80 |
Transportation |
|
|
No. of DLE turbines out of total no of turbines * |
2010 |
Achieve 85% by 2015 |
89 |
Storage |
|
|
Rated NOx emissions on turbine installed capacity |
2010 |
Achieve 6 mg/ |
6.2 |
Storage |
|
|
No. of hours of operation of DLE turbines out of total hours of operation of turbines |
2010 |
Achieve 85% by 2015 |
87 |
Transportation |
|
|
|
|
||||