Results
In order to allow for a better assessment of the performance of economic-financial operations, this Report includes the reclassified financial statements and some alternative performance indicators (non-GAAP measures), mainly represented by the results in the adjusted configuration21. Specifically, adjusted EBIT and adjusted net profit are obtained by excluding the special items (respectively gross and net of the related taxes) from the reported EBIT and the reported net profit, as per the Income Statement.
Income components classified as special items in 2020 are represented: (i) by financial expenses deriving from the repurchase of bonds on the market in the context of the liability management transaction (32 million euros, 24 million euros, net of the relative tax effect); (ii) by the costs incurred as a result of the Covid-19 pandemic-related emergency (27 million euros; 22 million euros net of the relative tax effect), mainly related to donations of medical supplies and cash to the Italian health system and the third sector (16 million euros), purchases of personal protective equipment for internal use and costs for services (11 million euros); (iii) by funds allocated to provisions for risks and charges (17 million euros) regarding the estimation of probable fiscal and financial charges in relation to circumstances and/or events already existing as at 31 December 2020.
21 For the definition of these indicators and the reconciliation with the related reported results, in line with the guidelines of the 2015/ESMA1415 document “ESMA Guidelines on Alternative Performance Measures” of 5 October 2015, please refer to the chapter “Financial review and other information – Non-GAAP measures ”.
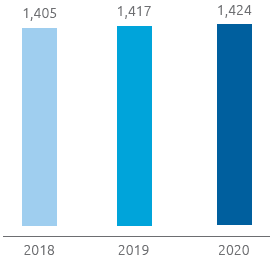
Adjusted EBIT (million €)
Adjusted results
Thanks to the solidity and efficiency of the operational management and strict financial discipline, Snam achieved positive results in line with expectations in 2020, notwithstanding the effects of the Covid-19 pandemic.
Adjusted EBITDA for 2020 amounts to 2,197 million euros, an increase of 28 million euros or 1.3% with respect to the adjusted EBITDA recognised in 2019. The positive contribution made by new energy transition businesses and Snam Global Solution (for approximately +13 million euros overall) and the greater regulated revenues deriving from the increase in the RAB base (+16 million euros), together with the continuation of actions under the Efficiency Plan (63 million euros of cost efficiencies compared to 2016) and the containment of costs following lockdown measures, have more than offset the reduction in regulated revenues deriving from the lower volumes transported following the Covid-19 health emergency, notwithstanding the fact that climate trends are in line with 2019.
Adjusted EBIT for 2020 totalled 1,424 million euros, up by 7 million euros (0.5%) compared with adjusted pro-forma EBIT for 2019. The aforementioned increase in EBITDA was partially absorbed by the natural increase in amortisation/depreciation (-40 million euros, 5.5%), essentially due to the entry of new assets to operations, partially compensated for by lower writedowns (+19 million euros, 63.3%).
With regard to business segments, thanks to higher regulated revenues linked to the increase in the RAB base, which more than absorbed the effects of a reduction in the volumes transported, the positive performance of the natural gas transportation sector was partially absorbed by a fall recorded in the storage sector, mainly attributable to tariff adjustment mechanisms and, in particular, lower incentives for new investments paid out for the fifth regulatory period.
Adjusted net profit (million €)
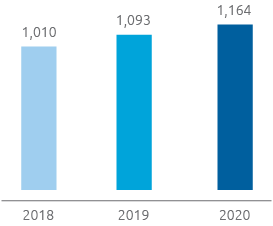
Adjusted net EBIT for 2020 totalled 1,164 million euros, up by 71 million euros (6.5%) compared with adjusted net profit for 2019. The increase is due to the greater EBIT, as well as: (i) the sharp decline in net financial expenses (+39 million euros; equivalent to 23.6%), thanks mainly to the actions to optimise the financial structure and management of the treasury, with the cost of gross debt coming to 0.9%, notwithstanding the greater average debt for the period, influenced by investments in equity investments as well as the payment of dividends to shareholders and the share buyback activity; (ii) greater revenue from equity investments (+33 million euros; +15.3%), including one-offs or temporary effects, attributable to investees TAP and TAG, which benefit from non-recurrent income components, as well as ADNOC Gas Pipelines, an equity investment acquired in July 2020.
Income taxes recorded an increase (8 million euros; equivalent to 2.1%) following the greater pre-tax profit, partly offset by the effects of the reintroduction of the ACE – Aid to Economic Growth benefit.
Net financial debt was 12,887 million euros at 31 December 2020 (11,923 million euros at 31 December 2019). Cash flow from operations (1,597 million euros) made it possible to fully cover net technical investment requirements (-1,110 million euros). Taking into account net outflows associated with the acquisition of equity investments (-522 million euros, including the shareholders loan to OLT acquired by Snam with the purchase of the equity investment), free cash flow stood negative at 35 million euros. The net financial debt, after equity cash flow deriving from the payment to shareholders of the 2019 dividend (779 million euros, of which an interim dividend of 313 million euros and 466 million euros for the balance) and the acquisition of treasury shares (114 million euros), recorded an increase of 964 million euros compared with 31 December 2019, including non-monetary components related to financial debt (36 million euros), which refer mainly to the change in the scope of consolidation and the financial debt recorded through the application of IFRS 16 “Leasing”.
Proposed dividend
0.2495 €
per share
Dividends
Our healthy results and solid business fundamentals allow us to propose a dividend of 0.2495 euros per share, to the Shareholders’ Meeting, of which 0.0998 euros per share was paid in January 2021 as an interim dividend (326 million euros) and the balance of 0.1497 euros per share will be paid from 23 June 2021 with an ex-dividend date of 21 June 2021 (record date 22 June 2021). The proposed dividend, up 5% compared with 2019, in line with the dividend policy announced in the strategic plan, confirms Snam’s commitment to guaranteeing shareholders an attractive remuneration that is sustainable over a period of time.
| Download XLS (13 kB) |
(million euros) |
2018 |
2019 |
2020 |
Change |
% change |
||||||
|---|---|---|---|---|---|---|---|---|---|---|---|
Regulated revenue (b) |
2,429 |
2,491 |
2,548 |
57 |
2.3 |
||||||
Total revenue (b) |
2,530 |
2,606 |
2,770 |
164 |
6.3 |
||||||
Operating costs (b) |
435 |
437 |
573 |
136 |
31.1 |
||||||
EBITDA |
2,095 |
2,169 |
2,197 |
28 |
1.3 |
||||||
EBIT |
1,405 |
1,417 |
1,424 |
7 |
0.5 |
||||||
Net profit (c) |
1,010 |
1,093 |
1,164 |
71 |
6.5 |
||||||
|
|||||||||||
| Download XLS (12 kB) |
(million euros) |
2018 |
2019 |
2020 |
Change |
% change |
||
|---|---|---|---|---|---|---|---|
EBIT |
1,384 |
1,452 |
1,380 |
(72) |
(5.0) |
||
Net profit (a) |
960 |
1,090 |
1,101 |
11 |
1.0 |
||
|
|||||||
| Download XLS (13 kB) |
|
|
2018 |
2019 |
2020 |
Change |
% change |
||||
|---|---|---|---|---|---|---|---|---|---|---|
Net profit per share (a) |
(€) |
0.286 |
0.330 |
0.336 |
0.006 |
1.9 |
||||
Adjusted net profit per share (a) |
(€) |
0.301 |
0.331 |
0.356 |
0.025 |
7.4 |
||||
Group shareholders’ equity per share (a) |
(€) |
1.78 |
1.90 |
1.98 |
0.08 |
4.3 |
||||
Pay-out (Relevant dividend/Group net profit) (b) |
% |
77.71 |
71.56 |
74.11 |
2.55 |
3.6 |
||||
Dividend yield (Relevant dividend/Year-end official share price) (b) |
% |
5.9 |
5.1 |
5.1 |
0.0 |
0.0 |
||||
Price/Book value (Official average price per share/Group shareholders’ equity per share) |
(€) |
2.10 |
2.36 |
2.23 |
(0.13) |
(5.4) |
||||
|
||||||||||
| Download XLS (13 kB) |
|
|
2018 |
2019 |
2020 |
Change |
% change |
||
|---|---|---|---|---|---|---|---|---|
Number of shares of share capital |
(million) |
3,469 |
3,395 |
3,361 |
(34) |
(1.0) |
||
Number of shares outstanding |
(million) |
3,301 |
3,292 |
3,270 |
(22) |
(0.7) |
||
Average number of shares outstanding during the year |
(million) |
3,358 |
3,301 |
3,272 |
(29) |
(0.9) |
||
Year-end official share price |
(€) |
3.820 |
4.686 |
4.601 |
(0.085) |
(1.8) |
||
Official average price per share for the year |
(€) |
3.747 |
4.474 |
4.417 |
(0.057) |
(1.3) |
||
Stock Market Capitalisation |
(million) |
12,606 |
15,428 |
15,046 |
(382) |
(2.5) |
||
Dividend per share |
(€ per share) |
0.2263 |
0.2376 |
0.2495 |
0.0119 |
5.0 |
||
Dividends for the year in question (*) |
(million) |
746 |
780 |
816 |
36 |
4.6 |
||
Dividends paid in the financial year |
(million) |
731 |
746 |
779 |
33 |
4.4 |
||
|
||||||||