Operating review
Gas Moved Through The Storage System
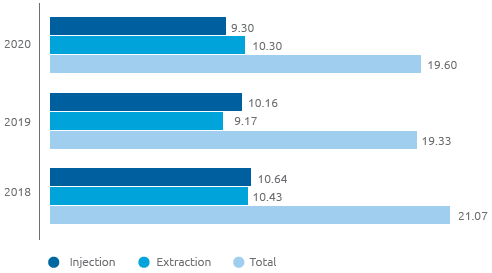
Volumes of gas moved through the storage system in 2020 amounted to 19.60 billion cubic metres, an increase of 0.27 billion cubic metres, or 1.40%, compared with 2019. Greater disbursements to deal with the reduction in injections to the national network were partially compensated for by lower injections in storage.
Gas moved through the storage system (billion cubic metres)
Organisational Changes
At the end of 2020, the number of personnel in service totalled 62, essentially in line compared with 31 December 2019 (61).
Following the conclusion of the integration project, transportation-storage dispatching operations are managed through an integrated procedure.
Under the project for the rationalisation and simplification of the current Snam regulatory framework the process for issuing rules to simplify and standardise operating processes was further integrated, including the document for the management of the availability and traceability of operating personnel.
Accidents
In 2020, there were no accidents involving either employees, while there was 1 accident involving a contract worker.
| Download XLS (12 kB) |
|
2018 |
2019 |
2020 |
|---|---|---|---|
Total employee accidents |
0 |
0 |
0 |
Total contractor accidents |
0 |
0 |
1 |
| Download XLS (12 kB) |
|
2018 |
2019 |
2020 |
||||
|---|---|---|---|---|---|---|---|
Employees |
|
|
|
||||
Frequency index (*) |
0 |
0 |
0 |
||||
Severity index (**) |
0 |
0 |
0 |
||||
Contractors |
|
|
|
||||
Frequency index (*) |
0 |
0 |
0.99 |
||||
Severity index (**) |
0 |
0 |
0.06 |
||||
|
|||||||
Energy Consumption and Emissions
In 2020 energy consumption for gas storage fell by 6% compared with 2019, in line with the reduction in gas stored. In 2020, nitrogen oxide (NOx) emissions totalled around 111 tonnes (-4.3% compared with 2019). In order to minimise these emissions, a programme has been launched over the years to replace conventional turbines with low-emission turbines (DLE), which, to date, have replaced almost all of the turbines installed. In particular, all storage sites operated with low emission units.
| Download XLS (12 kB) |
|
2018 |
2019 |
2020 |
||
|---|---|---|---|---|---|
Energy consumption (TJ) |
5,337 |
4,784 |
4.483 |
||
Emissions of CO2eq – scope1 (kt) (*) |
473 |
424 |
336 |
||
Natural gas emissions (106 m3) |
10.5 |
9.2 |
5.2 |
||
NOx emissions (t) |
236 |
116 |
111 |
||
|
|||||