Operating review and sustainability impacts
Technical investments
Plant security and quality levels


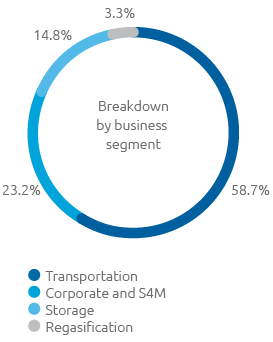
Technical investments for 2020, totalling 1,189 million euros22, up on 2019 (+226 million euros; +23.5%) and in line with forecasts, despite the difficulties deriving from the restrictions that characterised the first part of the year due to Covid-19, and related mainly to the transportation (981 million euros) and storage (134 million euros) business segments.
Investments in projects aimed at maintaining plant security and quality totalled 529 million euros for transportation (336 million euros in 2019) and 101 million euros for storage (57 million euros in 2019).
Snam guarantees 360° degree monitoring of its assets, committing to the study and development of technologies which make it possible to have full control over infrastructure. In order to detect potentially critical situations on the network and act in a timely manner in the event of unforeseen external phenomena, the methane pipelines are regularly inspected by qualified personnel, including through the use of motor vehicles, helicopter or drone overflights, or technology.
To control and check the pipelines, Snam uses an intelligent device equipped with sensors, called “pig”, which, by travelling inside the gas pipelines, allows to detect any defects or anomalies in terms of the material or minimum pipe movements.
Moreover, Snam has implemented a pipe inspection method through a detection system able to identify any methane leaks (Leak Detection); this activity responds to the ARERA directives which require the entire network to be monitored every 3 years.
The Company has always constantly monitored the technological evolution, in order to identify solutions that are potentially applicable to its own business and capable of improving the quantity and quality of checks on all its assets, for the purpose of increasing reliability and safety over time. Ever since their invention, Snam has trialled and, where deemed effective and applicable, subsequently adopted various in line inspection solutions, which have evolved from the use of simple internal pipeline cleaning devices to advanced devices equipped with complex systems of sensors capable of identifying deformations in the pipe section, any construction defects or corrosion, as well as any movements in the pipeline’s axis over time.
Experimental activities are currently in an advanced state of implementation, involving the use of satellite survey technologies in order to assess the possibility of improving the ability to intercept potential activities that interfere with and could damage or jeopardise the integrity of the pipelines, and to identify geographical areas characterised by land movements of a particularly slow nature that cannot be identified with the conventional monitoring methods currently employed (periodic geological surveying by qualified geologists), which potentially pose a danger to the maintenance of the pipeline’s integrity over time.
Lastly, Snam carries out continuous monitoring and control activity on its storage facilities through detection systems which activate when needed to immediately ensure the safety of the facilities. The most commonly used systems related to fire, smoke, pressure and gas leak detection.
| Download XLS (12 kB) |
(km) |
2018 |
2019 |
2020 |
|---|---|---|---|
Network inspected using smart pigs |
1,651 |
1,651 |
1,487 |
Network inspected using helicopter overflights |
18,462 |
20,178 |
20,662 |
Network inspected with Leak Detection technology |
|
|
10,535 |
Network subject to geological inspection |
4,209 |
5,163 |
4,438 |
Interconnected transportation-storage capacity and network utilisation
The average transportation capacity provided in 2020 was 363.1 million cubic metres/day on average, which was in line with 2019, while transferred capacity totalled 207.2 million cubic metres/day on average. Network saturation23 was 57.1%, a decrease compared with 2019 (63.8%).
The number of active transportation users in 2020 was 213, compared with 150 active users in 2019. In 2020, 103 connection agreements were entered into for the creation of new delivery/redelivery points or for upgrading existing ones, 19 contracts for the injection of biomethane and 35 relating to CNG service areas.
The total storage capacity at the end of 2020, on a like-for-like basis with strategic storage, came to 17.0 billion cubic metres, thanks to the Bordolano field gradually coming into operation, confirming the most extensive capacity at the European level for 2020 too. There were 91 active storage customers (unchanged from 2019).
Business volumes
In 2020, a total of 69.97 billion cubic metres of gas was injected into the network, a decrease of 5.40 billion cubic metres (-7.2%) compared with 2019. The reduction is due to the significant decline in gas demand, which comes to 71.30 billion cubic metres (-3.18 billion cubic metres; -4.3%), due to the decrease in withdrawals in all consumption sectors. More specifically, the drop in gas demand is attributable: (i) to lower consumption in the thermoelectric sector (-1.47 billion cubic metres; -5.5%), following the decrease in electricity demand due to the lockdown measures implemented to contain Covid-19, in particular during the months from March to June, as well as the increase in photovoltaic production, partially offset by a significant drop in imports of electricity and a reduction in hydroelectric and wind production; (ii) to lower consumption in the industrial sector (-0.91 billion cubic metres; -5.3%), due to a 12% reduction in industrial production with respect to 2019, intensified by the closure of various productive activities during the lockdown (March/April), followed by a slow recovery in industrial production which has not yet returned to pre-Covid levels. Additionally, the reduction in gas demand was affected by lower consumption in the residential and tertiary sector (-0.72 billion cubic metres; -2.6%), essentially due to a progressive increase in energy efficiency measures and modernisation of heating systems with higher efficiency hot water heaters, relative to similar climate conditions in the two periods.
71.30 bcm
Gas demand
(-4.3% compared with 2019)
71.60 bcm
Normalised gas demand
(-4.4% compared with 2019)
60 methane
tankers
unloade
(+39 compared with 2018)
19.60 bcm
Gas moved through
the storage system
Total storage capacity as at 31 December 2020, including strategic storage, was 17.0 billion cubic metres (unchanged with respect to 2019), of which 12.5 billion cubic metres related to available capacity fully allocated for the thermal year 2020-2021 and 4.5 billion cubic metres related to strategic storage (unchanged compared with thermal year 2019-2020, as established by the Ministry of Economic Development by means of the notice dated 17 January 2020.
Volumes of gas moved through the storage system in 2020 amounted to 19.60 billion cubic metres, an increase of 0.27 billion cubic metres, or 1.40%, compared with 2019. Greater disbursements to deal with the reduction in injections to the national network were partially compensated for by lower injections in storage.
During 2020, the Panigaglia (La Spezia) terminal regasified 2.52 billion m3 LNG (2.40 billion m3 in 2019; +5%).
The continued increase in volumes of activities compared with 2018 (0.91 billion m3 in 2018, more than doubled in 2020) is mainly due to the greater competitiveness of the cost of LNG compared with natural gas, as well as the new regasification capacity allocation mechanisms through dedicated auctions.
In 2020, 60 methane tankers were unloaded (+3 with respect to 2019; +39 with respect to 2018).
Key operating figures
In accordance with IFRS 8 “Operating Segments,” the operating segments that are reported separately were not changed and refer to regulated activities related to the transportation, regasification and storage of natural gas. Therefore, the new companies which head activities relating to the Energy Transition (sustainable mobility, energy efficiency and biogas/biomethane) are included in the “Corporate and other activities” segment, not operating under the terms of IFRS 8. An analysis of EBIT by business segment is provided in the “Business segment operating performance” section.
| Download XLS (13 kB) |
|
2018 |
2019 |
2020 |
Change |
% change |
||||||||||
|---|---|---|---|---|---|---|---|---|---|---|---|---|---|---|---|
Natural gas transportation (a) |
|
|
|
|
|
||||||||||
Natural gas injected into the National Gas Transportation Network (billion cubic metres) (b) |
72.82 |
75.37 |
69.97 |
(5.40) |
(7.2) |
||||||||||
Gas transportation network (kilometres in use) |
32,625 |
32,727 |
32,647 |
(80) |
(0.2) |
||||||||||
Liquefied Natural Gas (LNG) regasification (a) |
|
|
|
|
|
||||||||||
LNG regasification (billion cubic metres) |
0.91 |
2.40 |
2.52 |
0.12 |
5.0 |
||||||||||
Natural gas storage (a) |
|
|
|
|
|
||||||||||
Available storage capacity (billion cubic metres) (c) |
12.4 |
12.5 |
12.5 |
|
|
||||||||||
Natural gas moved through the storage system (billion cubic metres) |
21.07 |
19.33 |
19.01 |
(0.32) |
(1.7) |
||||||||||
Employees in service at year end (number) (d) |
3,016 |
3,025 |
3,249 |
224 |
7.4 |
||||||||||
of which business segment: |
|
|
|
|
|
||||||||||
- Transportation |
1,915 |
1,945 |
1,910 |
(35) |
(1.8) |
||||||||||
- Regasification |
64 |
65 |
67 |
2 |
3.1 |
||||||||||
- Storage |
59 |
61 |
62 |
1 |
1.6 |
||||||||||
- Corporate and other activities (e) |
978 |
954 |
1,210 |
256 |
26.8 |
||||||||||
|
|||||||||||||||
Staff employment and development


The number of employees in service at 31 December 2020 was 3,249, an increase of 224 (+7.4%) over 2019. Over the year, the following were recorded:
- the entry of 376 resources, of which 137 were due to the entry of Mieci and Evolve into the scope of consolidation, and 226 were appointed from the market, including to strengthen new energy transition businesses, particularly in the field of biomethane.
- the exit of 152 resources, principally due to termination of employment relationships (143), 47 of which were unilateral.
With respect to the Group’s distribution country-wide, 2,495 people are employed in the northern regions of Italy, 246 in the central regions and 498 in the south and Sicily. Moreover, 10 resources are permanently in service abroad.
During 2020, 66,385 hours of training were delivered with 17,277 participants, involving 90% of the company workforce (95% of women participated in at least one training course). On average, 20.4 hours of training took place per employee (20.8 hours on average for male staff and 18.5 for female staff).
Industrial relations

During 2020, Snam maintained a constant relationship with Trade Unions at the national and local level through 155 teleconferencing meetings, in line with government provisions and specific business policies aimed at containing the spread of Covid-19.
The Parties discussed several plans for the evolution of consolidated and recently created businesses, as well as issues of organisational importance triggered by the crisis situation that had emerged over the year.
In particular, pathways deriving from the integration of commercial and physical dispatches were discussed and established, in order to optimise transportation and storage activities.
As regards the regasification business, meetings were held with the Trade Unions, nationally and locally, in order to share and discuss topics intrinsic to the business evolution. The Parties met to establish productivity and profitability indicators for the 2020 Participation Bonus for Group companies and the benefits related to the 2019 bonus were booked. Moreover, a series of trade union discussions on smart working was set up, to extend that way of working to the business’s entire office-based population, including operational units in the territory in response to the pandemic.
Supply chain management24

Snam adopts an ‘extended’ management model aimed at going beyond the boundaries of its company perimeter in order to empower supply chain operators (suppliers and subcontractors). In this framework, everyone is encouraged to achieve increasingly sustainable performance in terms of risk mitigation, innovation of management processes, increasing in operational efficiency and the promotion of responsible governance procedures. Moreover, in consideration of the new objectives linked to the reduction of Scope 3 emissions included in the new Towards Net Zero Strategic Plan, it is even more necessary and important to establish collaboration and a mutual commitment from Snam and its suppliers and subcontractors in order to tackle climate change.
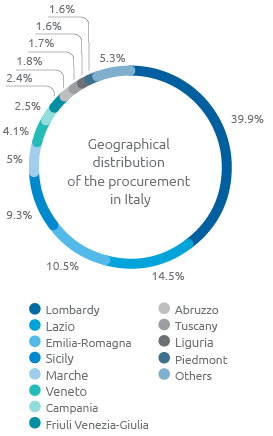
In 2020, there were 541 suppliers under contract, of which 377 belong to the small-medium business (SME) sector (69% of the total), concluding 1,338 procurement contracts worth a total of approximately 1,832 million euros (+18% compared with 2019). From the geographical point of view, more than 96% of assets, works and services were acquired in Italy, involving suppliers located throughout almost all of the national territory (19 regions). Among the goods purchased, the most important material is steel (piping, connectors, etc.) which, in 2020, amounted to a supply of approximately 84,000 tonnes.
As regards the companies TEP, IES Biogas, Cubogas and Snam 4 Environment, together with their subsidiaries, 189 million euros worth of goods and services were procured from more than one thousand suppliers belonging to the new businesses sector (mobility, biomethane and hydrogen).
| Download XLS (11 kB) |
(million euros) |
2018 |
2019 |
2020 |
|---|---|---|---|
Value of procurement |
1,520 |
1,550 |
1,832 |
Snam also incurred expenses of approximately 11 million euros for the supply of goods and services to ensure the safety of its own employees and deal with the Covid-19 pandemic in the best possible way.
To ensure the adequacy of suppliers in relation to current and future procurement requirements, Snam is constantly conducting market intelligence analyses and scouting activities for new suppliers. Thus, the correct balancing of the number of supplier companies on the Vendor List is ensured, according to criteria that follow the evolution of the need to acquire goods, works and services over time.
In 2020, the number of suppliers on the Vendor list and the related product groups were rationalised (-12% and -7%, respectively, compared to 2019), researching new and efficient synergies between the supplier companies already available, and, at the same time, the population of suppliers linked to energy transition activities and Snam’s new businesses was increased, together with critical activities connected to the management of the health emergency.
In 2020, over 700 businesses were contacted and more than 1,000 new candidates were activated for accreditation/qualification. The number of spontaneous candidatures increased by 2.7% compared to 2019, coming to 1,007.
As at 31 December 2020, the total number of qualified suppliers was 1,855, of which 221 belonged to the most important and strategic product categories (A and B). Snam exercises control of its supply chain by monitoring supplier performance during the execution phase of contracts through audits, inspections and evaluation processes. During the course of the year, 877 feedback reports were collected, relating to the services of 166 suppliers (+41% compared to 2019), 371 contracts were analysed and, in line with the promotion of sustainable behaviours along the supply chain, 3,815 audits on the tax compliance of 1,768 suppliers and subcontractors were also carried out, detecting irregularities in 2.28% of cases (+1.3% compared with 2019).
Moreover, with regard to the fight against corruption, all suppliers and subcontractors are required to accept the Integrity Ethics Pact and are subject to reputational checks. In 2020 2,758 reputational checks were conducted on suppliers and contractors. Moreover, since July 2020, Snam has been introducing a new category of checks carried out on its own suppliers, called “Compliance Checks”, which also entail the analysis of the financial solidity of suppliers (or aspiring suppliers), as well as their suitability and fitness both from a technical point of view and in terms of HSEQ.
In procurement of works related to Snam’s core activities, the suppliers considered critical (critical levels A and B) must be in possession of quality and environment management systems certified with ISO 9001, ISO 14001, OHSAS 18001 and ISO 45001 standards.
To evaluate the performance of its own suppliers over time, Snam uses a rating index (IR) that takes into consideration compliance with technical contractual requirements (Quality), health-safety-environment (HSE), agreed delivery times (Level of service), establishing a good relationship with the customer for the entire duration of the contract (Behaviour). Snam may restrict, suspend or even revoke the qualification of a supplier who fails to meet the agreed standards. In 2020, 13 provisions were issued in this area.
Health and safety
Although the issues of health and safety at work have become even more important during the course of 2020, sue to the Covid-19 pandemic, Snam is constantly committed to developing and promoting health and safety in the workplace. Research into and the adoption of good business practices is subject to gradual promotion not only within the company, but also vis-à-vis suppliers, to extend and improve collaboration so as to achieve the best performance.
In 2020 a total of 5 accidents took place (7 in 2019), 3 of which involved Snam Group employees (2 in 2019). All of them took place in companies in the unregulated sector (2 Cubogas and 1 Mieci), and 2 involved contractors (5 in 2019), with one sadly resulting in a fatality.
In 2020, the accident frequency index for employees was 0.59, a slight increase compared to 2019 (0.41), while for contractors it was 0.25, a reduction compared to 2019 (0.71).
The accident severity index for employees was 0.01, a reduction compared to 2019 (0.03), while for contractors it was 0.93, a marked increase compared to 2019 (0.07) due to the fatal accident25.
Overall, for employees and contractors, the frequency index was 0.38 while the severity index was 0.58.
Frequency index Employees and contractors
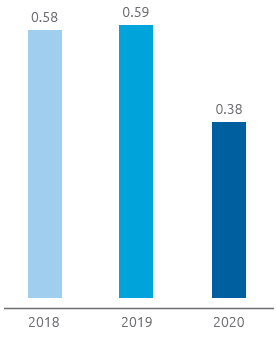
The frequency index was calculated as days of absence for injury / total hours worked.
Severity index (including fatalities) Employees and contractors
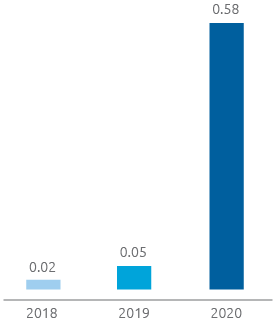
The severity index was calculated as number of injuries / total hours worked.
Frequency index
Employees and contractors
In the past 10 years, Snam has disseminated a culture based on protecting health, preventing injuries and safety at all levels of the Company, involving the whole corporate population and contractors. This approach enabled a constant reduction of injuries.
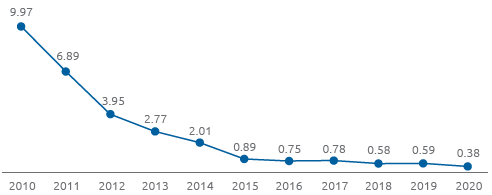
* The frequency index was calculated as days of absence for injury / total hours worked.
Energy consumption

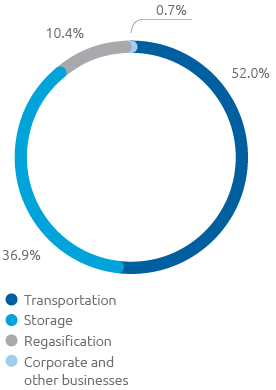
The main sources of Snam’s energy consumption are the gas turbines used in compression facilities, which in 2020 represented 82% of total consumption. Moreover, 2020 saw an increase in the consumption of the regasification plant (+4% compared to 2019), in line with the increase in quantities of gas being regasified and a simultaneous reduction in consumption for storage (-6% compared to 2019), in line with the reduction in stored gas.
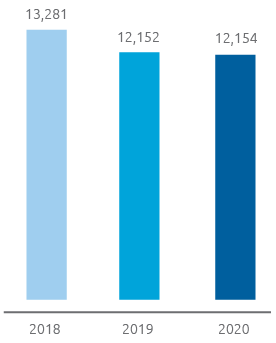
In 2020 total energy consumption was 12,154 TJ (similar to in 2019, +0.02%), influenced principally by the use of backbone pipelines for importation. In fact, during the course of the year, a 7% reduction in gas injected into the network compared to 2019 was recorded; the gas was transported by the North Africa backbone route, which is more energy-intensive than the northern Europe and Russia backbones.
The Company’s energy mix is almost entirely made up of natural gas (95.4%); the other sources of which it is composed are electricity (increased from 3.5% in 2019 to 3.8% in 2020) and other fuels (diesel fuel, gasoline, LPG and heat), which together amount to 0.8% of the total consumption.
Energy consumption (TJ)
Energy consumption by business segment
Greenhouse gas emissions
Total GHG emission were approximately 1.74 million tonnes of CO2eq (-13% compared with 2019). The total reduction in emissions was principally due to various concurrent causes, including:
- recovery of natural gas emissions through gas recompression, hot tapping26 and Leak Detection and Repair (LDAR);
- production and/or purchase of electricity from renewable sources;
- installation of facilities with LED lighting;
- installation of more energy-efficient heat generators;
- restructuring and improvements to the energy-efficiency of buildings;
- increase in smart working.
In 2020, Snam reduced its atmospheric emissions by more than 200 thousand tonnes of CO2eq, a much higher figure than for 2019 (+12%), and it also avoided the emission of more than 10 million m3 of natural gas, equivalent to 183 thousand tonnes of CO2eq (+11% compared to 2019).
Direct GHG emissions – Scope 1 (kt CO2eq)*
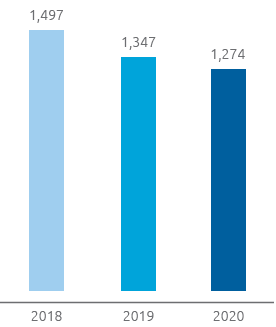
* The emissions of CO2eq were consolidated according to the operational control approach. The GHG gases included in the calculation are CO2 and CH4 and the emissions are calculated with a GWP of methane equal to 28, as indicated in the scientific study by the Intergovernmental Panel on Climate Change (IPCC) “Fifth Assessment Report IPCC”
Direct emissions of CO2eq came to 1.27 million tonnes. Of these, 0.66 million tonnes were attributable to fuel emissions, while CO2eq emissions deriving from methane and HFC emissions amounted to approximately 0.62 million tonnes and 0.001 million tonnes (-11% compared with 2019 and -20% compared with 2018, respectively). Natural gas emissions stood at 35 million m3, down compared with 39.2 million m3 in 2019.
Indirect CO2eq emissions from energy consumption derived from the procurement of electricity and heat generated by third parties, which the Company uses for its own activities. Electricity consumption, which came approximately 128,750 MWh, increased by 10% compared to 2019, principally caused by the Renerwaste sites (not accounted for in 2019). Notwithstanding the increase, emissions did not increase for those sites, as almost 60% of the electricity consumed was generated by renewable sources.
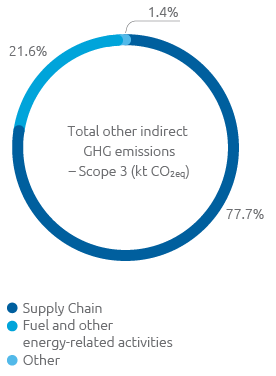
CO2eq emissions, calculated according to the market based approach, came to 31.3 thousand tonnes, down compared to 2019 (-3.4%), thanks precisely to the growing use of renewable energy sources, thus avoiding the atmospheric emission of approximately 18,600 tonnes of CO2eq, an increase compared to the 16,100 tonnes avoided in 2019. As regards Scope 3 emissions, in 2020 the Group implemented a number of measures to calculate and subsequently reduce such emissions. Of these measures, Snam intends to continue to request its suppliers to complete the CDP Supply Chain questionnaire, promote working groups for the establishment of a common strategy for reducing emissions, hold thematic meetings on problems related to climate change and introduce stricter sustainability criteria in the choice of suppliers.
With regard to Scope 3 emissions, in 2020 some 8 different categories pertaining to such emissions were accounted for, therefore recalculating the emissions of previous years. In 2020, Scope 3 emissions came to approximately 433 thousand tonnes, a 31% reduction on the recalculated 2019 figure, following a decline in procurement and the different nature of the supplies. The 433 thousand tonnes of CO2eq relating to scope 3 emissions does not include the category linked to investments (which historically represents approximately 50% of total scope 3 emissions), due to the timing of data validation by investee companies.
Lastly, as regards carbon dioxide emissions from the Snam Group facilities covered by the ETS, overall they were greater than the allocated emission allowances. The allocation of free allowances by the competent national authority each year is gradually reduced each year as set out from the third regulatory period in Article 10 bis of Directive 2009/29/EC, which ended in 2020. In view of around 0.615 million tonnes of carbon dioxide emitted into the atmosphere, around 0.120 million tonnes were allocated free of charge, resulting in a 0.495 million tonne deficit.
Indirect GHG emissions – Scope 2 (kt Co2eq)

22 An analysis of the technical investments made by each business segment is provided in the “Business segment operating performance” section of this Report.
23 Ratio of capacity transferred to available capacity.
24 The figures in this paragraph relate to the following companies only: Snam, SRG, GNL Italia, Stogit, Enura, Snam 4 Mobility, Cubogas.
25 One fatal accident is computed as 7,500 days of absence.
26 Advanced technique for the attachment of branches from pipelines in operation that make it possible not to interrupt the flow of gas or discharge the gas contained in the pipeline from which the branch leads.