Injections and gas withdrawals in the transportation network
| Download XLS (13 kB) |
(billions of m3) |
2018 |
2019 |
2020 |
Change |
% change |
||||
|---|---|---|---|---|---|---|---|---|---|
Domestic output |
5.12 |
4.51 |
3.86 |
(0.65) |
(14.4) |
||||
Entry points (**) |
67.70 |
70.86 |
66.11 |
(4.75) |
(6.7) |
||||
Tarvisio |
29.69 |
29.85 |
28.43 |
(1.42) |
(4.8) |
||||
Mazara del Vallo |
17.09 |
10.21 |
12.02 |
1.81 |
17.7 |
||||
Gries Pass |
7.76 |
11.13 |
8.60 |
(2.53) |
(22.7) |
||||
Cavarzere (LNG) |
6.71 |
7.91 |
6.81 |
(1.10) |
(13.9) |
||||
Gela |
4.47 |
5.70 |
4.46 |
(1.24) |
(21.8) |
||||
Livorno (LNG) |
1.07 |
3.62 |
3.27 |
(0.35) |
(9.7) |
||||
Panigaglia (LNG) |
0.88 |
2.42 |
2.51 |
0.09 |
3.7 |
||||
Melendugno |
|
|
0.01 |
0.01 |
|
||||
Gorizia |
0.03 |
0.02 |
|
(0.02) |
(100.0) |
||||
|
72.82 |
75.37 |
69.97 |
(5.40) |
(7.2) |
||||
|
|||||||||
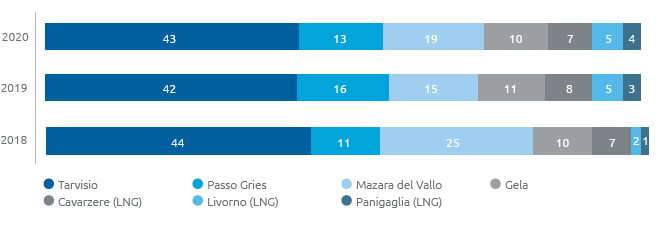
In 2020, a total of 69.97 billion cubic metres of gas was injected into the network, an decrease of 5.40 billion cubic metres (-7.2%) compared with 2019.
Injections into the network from domestic production fields or their collection and treatment centres totalled 3.86 billion cubic metres, down by 0.65 billion cubic metres (-14.4%) compared with 2019.
Volumes injected at entry points connected with other countries and with regasification plants, overall equal to 66.11 billion cubic metres, fell by 4.75 billion cubic metres (-6.7% with respect to 2019), in line with the decline in natural gas demand and the greater use of provisions from storage.
The lesser volumes injected from the LNG regasification terminals (-1.36 billion cubic metres; -9.7%), as well as from the entry points of Passo Gries (-2.53 billion cubic metres; -22.7%), Tarvisio (-1.42 billion cubic metres; -4.8%) and Gela (-1.24 billion cubic metres; -21.8%), were partly offset by the higher volumes injected from the Mazara del Vallo entry point (+1.81 billion cubic metres; -17.7%).
Natural gas injected into the network by import point (% of total gas injected)
| Download XLS (12 kB) |
(billions of m3) |
2018 |
2019 |
2020 |
Change |
% change |
||||
|---|---|---|---|---|---|---|---|---|---|
Redelivery to domestic market |
71.49 |
73.04 |
70.01 |
(3.03) |
(4.1) |
||||
Exports and transit (*) |
0.45 |
0.37 |
0.36 |
(0.01) |
(2.7) |
||||
Consumption and emissions, Snam Rete Gas |
0.27 |
0.23 |
0.23 |
|
|
||||
Unaccounted for gas and other changes (**) |
0.18 |
0.33 |
0.30 |
(0.03) |
(9.1) |
||||
Total natural gas withdrawals |
72.39 |
73.97 |
70.90 |
(3.07) |
(4.2) |
||||
|
|||||||||
Natural gas withdrawn from the national transportation network in 2020 (70.90 billion cubic metres; -4.2 with respect to 2019) mainly went to: (i) redelivery to users at network exit points (70.01 billion cubic metres; -4.1%); (ii) exports and transit (0.36 billion cubic metres or -2.7%); and (iii) consumption by the compression stations and gas emissions from the network and from Snam Rete Gas plants (0.23 billion cubic metres, the same as in 2019).
| Download XLS (13 kB) |
(billions of m3) |
2018 |
2019 (a) |
2020 |
Change |
% change (b) |
||||||||||
|---|---|---|---|---|---|---|---|---|---|---|---|---|---|---|---|
Total gas injected into the network |
72.82 |
75.37 |
69.97 |
(5.40) |
(7.2) |
||||||||||
Net balance storage withdrawals/injections (c) |
(0.43) |
(1.40) |
0.93 |
2.33 |
|
||||||||||
Total natural gas withdrawals |
72.39 |
73.97 |
70.90 |
(3.07) |
(4.2) |
||||||||||
Exports (-) (d) |
(0.45) |
(0.37) |
(0.36) |
0.01 |
(2.7) |
||||||||||
Gas injected in other operator regional network |
0.03 |
0.03 |
0.03 |
|
|
||||||||||
Other consumption (e) |
0.69 |
0.85 |
0.72 |
(0.13) |
(14.8) |
||||||||||
Total demand Italy |
72.67 |
74.48 |
71.30 |
(3.18) |
(4.3) |
||||||||||
|
|||||||||||||||
The transportation capacity of the network again covered all user demand in 2020. Average transportation capacity provided in 2020 at the entry points connected with foreign pipes and at regasification facilities was 363.1 million cubic metres on average per day, 19.1 of which were offered as competing capacities between the Mazara del Vallo and Gela entry points. In addition to the aforementioned capacities which concern the entry points interconnected with foreign countries and the LNG terminals, a transportation capacity is available at the domestic production entry points:
- national production at a total of 22.00 million cubic metres/day.
- the production of biomethane at a total of 0.6 million cubic metres/day.
- production from virtual entry points (PIV) connected to distribution networks/other transportation networks for a total of 0.1 million cubic metres/day.
| Download XLS (13 kB) |
(billions of m3/day) |
Calendar year 2018 |
Calendar year 2019 |
Calendar year 2020 |
||||||||||
|---|---|---|---|---|---|---|---|---|---|---|---|---|---|
Entry points |
Transportation capacity |
Capacity transferred |
Saturation (%) |
Transportation capacity |
Capacity transferred |
Saturation (%) |
Transportation capacity |
Capacity transferred |
Saturation (%) |
||||
Tarvisio (**) |
111.1 |
107.4 |
96.7 |
110.6 |
98.3 |
88.9 |
113.0 |
88.5 |
78.3 |
||||
Mazara del Vallo (*) (**) |
82.0 |
81.2 |
99.0 |
86.7 |
36.1 |
41.6 |
85.6 |
36.9 |
43.1 |
||||
Gries Pass |
64.4 |
34.8 |
54.0 |
64.4 |
31.3 |
48.6 |
64.4 |
23.9 |
37.1 |
||||
Cavarzere (LNG) |
26.4 |
24.4 |
92.4 |
26.4 |
24.9 |
94.3 |
26.4 |
22.3 |
84.5 |
||||
Gela (*) |
20.3 |
20.1 |
99.0 |
22.9 |
19.0 |
83.0 |
22.4 |
17.2 |
76.7 |
||||
Livorno (LNG) |
15.0 |
15.0 |
100.0 |
15.0 |
14.3 |
95.3 |
15.0 |
11.7 |
78.0 |
||||
Panigaglia (LNG) |
13.0 |
4.0 |
30.8 |
13.0 |
7.4 |
56.9 |
13.0 |
6.7 |
51.5 |
||||
Gorizia |
4.2 |
0.1 |
2.4 |
4.0 |
0.1 |
2.5 |
4.2 |
|
|
||||
Competitor Capacity (*) |
24.4 |
|
|
19.9 |
|
|
19.1 |
|
|
||||
|
360.8 |
287.0 |
79.5 |
362.9 |
231.4 |
63.8 |
363.1 |
207.2 |
57.1 |
||||
|
|||||||||||||
Snam Rete Gas has prepared a long-term plan for available transportation, sent to the Ministry of Economic Development on 28/06/2019 and published on the Snam website at www.snam.it/en/transportation/index.html in the online services/capacity section.
The document shows data about capacity at all entry points interconnected with foreign countries and with LNG terminals for the thermal year 2020 – 2021 and subsequent years up to 30 September 2035.
Also shown for the thermal year 2020 – 2021 are the transportation capacities of the interconnected exit points with the foreign countries of Passo Gries, Gorizia, Bizzarone and San Marino at a total of 46 million cubic metres/day. As a result of all the infrastructures of the “Supporting the north-west market and two-way cross-border flows” project coming into service, a total capacity of 40 million cubic metres/day became available simultaneously at the Passo Gries and Tarvisio exit points. The maximum capacity of the Passo Gries exit point is 40 million cubic metres/day, while the maximum capacity of the Tarvisio exit point is 18 million cubic metres/day, therefore there is a “Competing capacity” pursuant to chapter 5, paragraph 3 of the Network Code available at the two points.
Over the last 15 years transportation operators have been constantly increasing, going from around 30 entities in 2003 to around 213 entities in 2020 (including shippers and traders), with the number of customers (shippers) standing at 145.
The number of PSV traders active in September 2020 (end of thermal year 2019-2020) is 68, compared to 69 PSV traders active in September 2019.
In 2020, 103 connection agreements were entered into for the creation of new delivery/redelivery points or for upgrading existing ones, 19 contracts for the injection of biomethane and 35 relating to CNG service areas.
Transportation and saturation capacity
Organisational Changes
During the course of 2020, the recorded number of personnel in service fell by a total of 35 resources, from 1,945 at 31 December 2019 to 1,910 resources at 31 December 2020.
The organisational structure of group companies operating in the transportation and dispatching business was redesigned with a view to greater consistency with the Snam guidelines of streamlining the organisation and processes, aimed specifically at reducing duplications with Snam units dedicated to commercial and technical activities, and integration of transportation and storage activities.
In relation to the opportunity to pursue economies of experience and scope that develop Group best practices, and to the specific requirements of other operating companies, several Snam Rete Gas structures provide technical services (for example, with regard to engineering and project management activities aimed at large investments). In addition, in relation to the organisational changes listed above, Snam Rete Gas also guarantees the supply to Stogit and GNL Italia of the commercial services previously delivery by Snam.
Accidents
In 2020 the number of accidents was 0 for employees and 1 for contractors, tragically fatal (compared with 0 and 5 accidents in 2019).
| Download XLS (12 kB) |
|
2018 |
2019 |
2020 |
|---|---|---|---|
Total employee accidents |
4 |
0 |
0 |
Total contractor accidents |
3 |
5 |
1 |
| Download XLS (12 kB) |
|
2018 |
2019 |
2020 |
||||
|---|---|---|---|---|---|---|---|
Employees |
|
|
|
||||
Frequency index (*) |
1.29 |
0.00 |
0.00 |
||||
Severity index (**) |
0.03 |
0.00 |
0.00 |
||||
Contractors |
|
|
|
||||
Frequency index (*) |
0.46 |
0.83 |
0.16 |
||||
Severity index (**) |
0.03 |
0.08 |
1.18 |
||||
|
|||||||
Energy Consumption and Emissions
Energy consumption for transport, totalling 6,321 Terajoules (TJ), increased by around 3% with respect to 2019 despite a reduction in gas injected into the network (-7%): the trend in energy consumption for gas transportation is heavily influenced by the use of import backbones and in 2020 more energy intensive pipelines were used (north Africa backbone) with respect to the northern Europe and Russia backbones which use less energy.
In 2020, nitrogen oxide (NOx) emissions totalled around 242 tonnes (-15.4% compared with 2019). In order to minimise these emissions, a programme has been launched over the years to replace conventional turbines with low-emission turbines (DLE), which, to date, have replaced almost all of the turbines.
| Download XLS (12 kB) |
|
2018 |
2019 |
2020 |
||
|---|---|---|---|---|---|
Energy consumption (TJ) |
7,463 |
6,123 |
6,321 |
||
Emissions of CO2eq – scope 1 (kt) (*) |
982 |
838 |
848 |
||
Natural gas emissions (106 m3) |
32.8 |
28.7 |
28.5 |
||
NOx emissions (t) |
305 |
286 |
242 |
||
|
|||||