Operating review
Gas Distribution On The National Transportation Network
Gas volumes are stated in standard cubic metres (SCM) with a traditional higher heating value (HHV) of 38.1 MJ/SCM (10,575 Kwh/SCM). The basic figure is measured in energy (MJ) and obtained by multiplying the physical cubic metres actually measured by the relative heating value.
| Download XLS (12 kB) |
(billions of m3) |
2018 |
2019 (a) |
2020 |
Change |
% change (b) |
||||||||
|---|---|---|---|---|---|---|---|---|---|---|---|---|---|
Residential and tertiary |
28.76 |
28.13 |
27.41 |
(0.72) |
(2.6) |
||||||||
Thermoelectric |
24.19 |
26.65 |
25.18 |
(1.47) |
(5.5) |
||||||||
Industrial (c) |
17.39 |
17.30 |
16.39 |
(0.91) |
(5.3) |
||||||||
Other (d) |
2.33 |
2.4 |
2.32 |
(0.08) |
(3.3) |
||||||||
|
72.67 |
74.48 |
71.30 |
(3.18) |
(4.3) |
||||||||
|
|||||||||||||
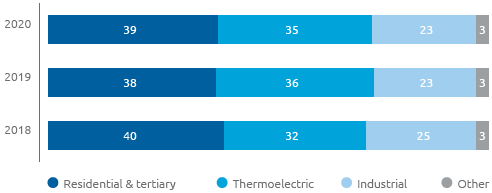
Gas demand in Italy in 2020 came to 71.30 billion cubic metres, showing a significant drop with respect to 2019 (of 3.18 billion cubic metres; -4.3%), due a decline in withdrawals in all consumption sectors. More specifically, the drop in gas demand is attributable: (i) to lower consumption in the thermoelectric sector (-1.47 billion cubic metres; -5.5%), following the decrease in electricity demand due to the lockdown measures implemented to contain Covid-19, in particular during the months from May to June, as well as the increase in photovoltaic production, partially compensated for by a significant drop in imports of electricity and a reduction in hydroelectric and wind production; (ii) to lower consumption in the industrial sector (-0.91 billion cubic metres; -5.3%), due to a 12% reduction in industrial production with respect to 2019, intensified by the closure of various productive activities during the lockdown (March/April), followed by a slow recovery in industrial production which has not yet returned to pre-Covid levels.
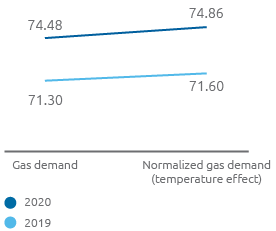
Additionally, the reduction in gas demand was affected by lower consumption in the residential and tertiary sector (-0.72 billion cubic metres; -2.6%), essentially due to a progressive increase in energy efficiency measures and modernisation of heating systems with higher efficiency hot water heaters, relative to similar climate conditions in the two periods. Gas demand adjusted for weather effects, estimated at 71.60 billion cubic metres, fell by 3.26 billion cubic metres (-4.4%) with respect to the corresponding amount in 2019 (74.86 billion cubic metres).
Gas demand by sector (% of total gas demand)
Gas demand (Bcm)
The availability of natural gas in Italy (70.90 billion cubic metres) is equal to the sum of gas injected into the National Transportation Network and the net balance of withdrawals from and injections into the storage system, and was down by 3.07 billion cubic metres (-4.2%) compared with 2019. The reduction is in line with the decrease in volumes of gas injected into the network (-4.75 billion cubic metres; -6.7%), as well as the reduction in domestic output (-0.65 billion cubic metres; -14.4%), combined with greater use of supplies from storage (0.93 billion cubic metres, with reference to net provisions).
| Download XLS (13 kB) |
(billions of m3) |
2018 |
2019 (*) |
2020 |
Change |
% change |
||||
|---|---|---|---|---|---|---|---|---|---|
From gas injected into the network by entry point |
67.70 |
70.86 |
66.11 |
(4.75) |
(6.7) |
||||
From domestic output |
5.12 |
4.51 |
3.86 |
(0.65) |
(14.4) |
||||
Total gas injected into the network |
72.82 |
75.37 |
69.97 |
(5.40) |
(7.2) |
||||
Net balance storage withdrawals/injections (**) |
(0.43) |
(1.40) |
0.93 |
2.33 |
|
||||
Total availability of natural gas |
72.39 |
73.97 |
70.90 |
(3.07) |
(4.2) |
||||
|
|||||||||
Impacts of Covid-19 on gas demand
Thermoelectric sector
The decrease in natural gas demand in the thermoelectric sector peaked from March-June 2020, during the closures implemented for Covid-19.
Thermoelectric sector – Consumption change (bcm)
Residential sector
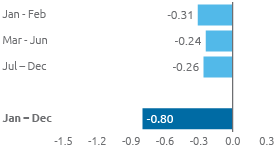
Changes in civil sector consumption after normalisation for January – December is mainly linked to the progressive increase in energy efficiency measures to which can be added, for the months of March and April, the effects of the lockdown on the tertiary sector, which contributed to a reduction in gas demand of approximately 150 million cubic metres.
Residential sector – Consumption change (bcm)
Industrial sector
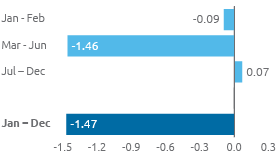
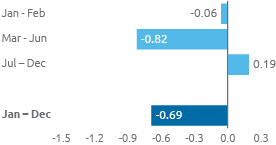
The decrease in natural gas demand in the industrial sector peaked from March-June 2020, during the closures implemented for Covid-19. On the other hand, the period from July – December 2020 saw a positive change, demonstrating a gradual recovery in activities.
Industrial sector – Consumption change (bcm)
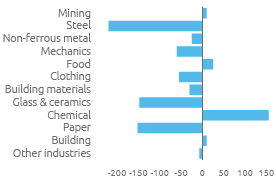
The sub-sectors most heavily impacted by the effects of Covid-19 were the glass/ceramics, iron/steel and paper sectors, which account for the entire drop in the industrial sector. The chemicals sector was positive.
Industrial sector – Consumption change by segment (bcm)