Protect health and safety
The protection of the health and safety of its workers has always been at the heart of the Company’s attention, considering the nature of the activities carried out by its employees on site and the operations required, for example, in infrastructure construction. To properly monitor this issue, all company activities are governed by management systems certified according to ISO 45001 on health and safety at work and the adoption of good practices, promoted and shared with suppliers.
The Group’s efforts have made it possible to maintain low injury rates, both for employees and contractors: in 2020, there were a total of 5 injuries (7 in 2019), of which 3 occurred to Snam Group employees (2 in 2019), all of which occurred in companies in the non-regulated sector (2 in Cubogas and 1 in Mieci), and 2 to contract suppliers (5 in 2019), of which one, unfortunately, was fatal.
Injuries at work
Employee and contractor frequency rate
Number of accidents at work resulting in absence of at least one day, per one million of hours worked.
Injuries at work
Employee and contractor severity rate
Number of work days lost, related to accidents at work resulting in absence of at least one day, per one thousand of hours worked.
A fatal accident is counted as 7,500 days of absence.
| Download XLS (11 kB) |
|
2018 |
2019 |
2020 |
||
|---|---|---|---|---|---|
Employees |
|
|
|
||
Total injuries (no.) |
4 |
2 |
3 |
||
Fatal accidents (no.) |
0 |
0 |
0 |
||
Accidents with severe consequences* (no.) |
- |
- |
0 |
||
Frequency rate |
0.84 |
0.41 |
0.59 |
||
Severity rate |
0.02 |
0.03 |
0.01 |
||
Contract workers |
|
|
|
||
Total injuries (no.) |
3 |
5 |
2 |
||
Fatal accidents (no.) |
0 |
0 |
1 |
||
Accidents with severe consequences* (no.) |
- |
- |
0 |
||
Frequency rate |
0.41 |
0.71 |
0.25 |
||
Severity rate |
0.03 |
0.07 |
0.93 |
||
Employees and contract workers |
|
|
|
||
Total injuries (no.) |
7 |
7 |
5 |
||
Accidents with severe consequences* (no.) |
- |
- |
0 |
||
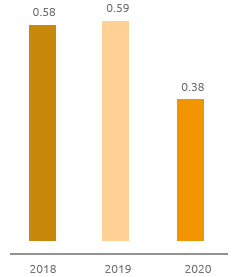
Frequency rate |
0.58 |
0.59 |
0.38 |
||
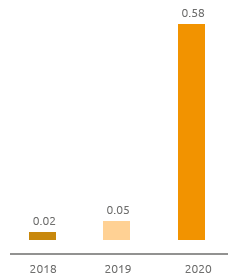
Severity rate |
0.02 |
0.05 |
0.58 |
||
|
|||||
| Download XLS (11 kB) |
|
2018 |
2019 |
2020 |
|---|---|---|---|
Car accidents |
2 |
0 |
0 |
Occupational accidents (maintenance, inspection, checks) |
1 |
1 |
2 |
Generic accidents (slipping, impact, tripping) |
1 |
1 |
1 |
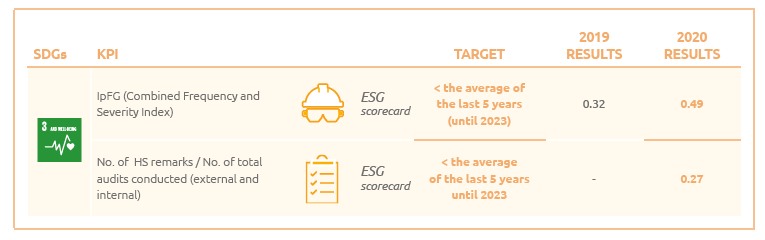
In the new ESG Scorecard, Snam has introduced a new target concerning the IpFG, the combined frequency and severity index, which makes it possible to assess in a single KPI both the number of accident events and their severity, with the goal that until 2023, it should be lower than the average of the last five years and that, in 2020, it should be 0.49.
Health and safety projects and awards at Snam
Among the many initiatives proposed by Snam to protect health and safety, of particular importance are those designed to spread a culture in which health protection, accident prevention and safety are the key elements in ensuring a safe working environment.
Snam4Safety is a project aimed at strengthening the safety culture and awareness of employees and contractors. In spite of the difficulties caused by the Covid-19 pandemic, the project continued in 2020, with the launch of a coaching activity for Operations Managers and Prevention and Protection Service Managers (ASPPs), with the support of DSS Sustainable Solutions Italy. This activity will continue in 2021.
As part of the Snam4Safety initiative, Snam has created the Zero Accident Award, whereby site employees commit to achieving 365 consecutive days without an accident – both at work and commuting (zero accident target). A tangible award is given to the winning staff each year. In 2020, 10 homogeneous teams involving a total of 1,535 employees received the award.
Protecting health
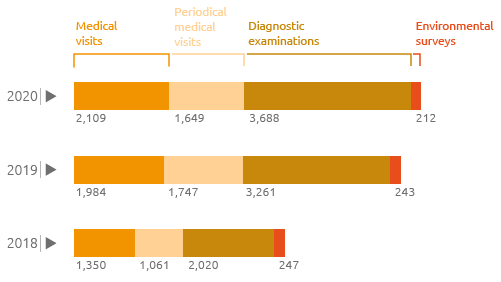
The health status of workers who, on account of the jobs they perform, are exposed to specific risk factors, is monitored through regular health checks, carried out by medical personnel trained for this purpose. To guarantee a working environment that complies with workplace hygiene standards, environmental screening is periodically carried out to monitor microclimate, biological and physical aspects of the workplaces. There are no recognised cases of occupational diseases of employees in the three-year reporting period.
Health checks (no.)
| Download XLS (11 kB) |
|
2018 |
2019 |
2020 |
||
|---|---|---|---|---|---|
Total exposed workers |
2,652 |
2,742 |
2,880 |
||
Workers who sit at a computer station (VDT) |
1,923 |
2,027 |
1,583 |
||
Workers with responsibility in an emergency |
599 |
594 |
596 |
||
Workers exposed to chemical agents |
10 |
65 |
41 |
||
Workers responsible for moving heavy loads (*) |
94 |
136 |
661 |
||
Night workers |
113 |
113 |
121 |
||
Workers exposed to noise pollution |
24 |
53 |
60 |
||
Workers exposed by synergy of several risks |
587 |
690 |
657 |
||
Workers exposed in confined spaces |
139 |
176 |
179 |
||
Workers exposed for other reasons (IE, abroad, TOX, welding) |
127 |
194 |
193 |
||
|
|||||
Protect employees from the Covid-19 pandemic
For the management of the health emergency due to the spread of the Covid-19 virus, an inter-functional team, named Crisis Management, has been in place since its inception (February 2020). The team had the fundamental task of assessing the level of risk to which Snam workers could be exposed and defining the appropriate precautionary and containment measures to ensure not only the protection of workers’ health in all operating conditions, but also the continuity of the service.
Snam, in addition to having implemented the shared Protocol for regulating measures to combat and contain the spread of the Covid-19 virus in the workplace, defined between the government and social partners, and integrated the Risk Assessment Documents considering the INAIL methodology on measures to contain contagion in the workplace, has:
- created a Health Protocol containing criteria and measures to protect the health and safety of workers at work, which is constantly updated according to epidemiological developments and regulations;
- organised a constant and widespread information campaign towards all workers;
- set up the Committee for the application and verification of the rules provided for in the Protocol defined between the Government and the social partners.
Health and safety: achievements over the last ten years
Number of injuries
(employees and contractors)
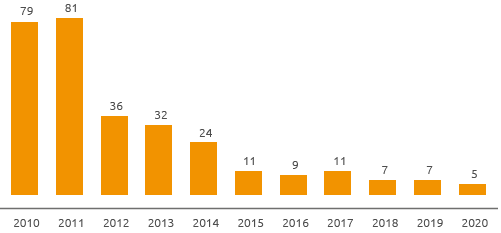
Given Snam’s business, which is engaged in gas transport, storage and regasification, as well as building infrastructure to support its activities, the issue of health and safety has always been monitored through numerous measures and initiatives, which have been constantly improved over the last ten years, aimed at effectively disseminating a culture based on health protection, accident prevention and safety at all levels of the Company, involving the entire workforce, as well as contractors.
Frequency rate*
(employees and contractors)
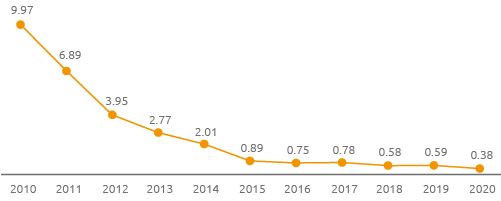
Safety performance has improved over time, suggesting the effectiveness that the initiatives implemented have had thanks to the careful coaching that Snam provides to both employees and contractors, in order to ensure the best safety conditions in any work context. This is evidenced by the trends in the frequency index and the total number of accidents involving employees and contractors, which have fallen significantly over the last ten years.
Severity rate (including fatalities)**
(employees and contractors)
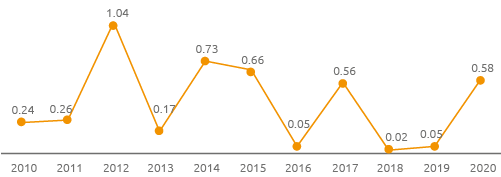
The trend in the severity index, influenced by the few fatal accidents (which have a significant impact on the index and explain the peaks present) also confirms the improving trend in safety performance.
* The frequency rate has been calculated as the number of injuries at work resulting in absence of at least one day, per one million of hours worked.
** The severity rate has been calculated as the number of work days lost, related to accidents at work resulting in absence of at least one day, per one thousand of hours worked. A fatal accident is counted as 7,500 days of absence.