Greenhouse gas emissions (GHG)
GHG emissions (ktCO2eq)
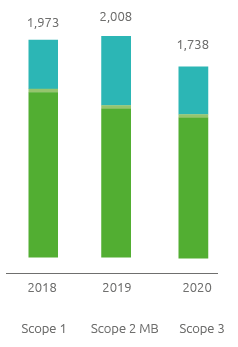
Scope 3 emissions do not include those
deriving from the investments category.
The 2018 and 2019 totals incorporate a
recalculation of Scope 3 emissions.
Snam is aware that the world has an urgent need for “clean” energy: for this reason, in its new Strategic Plan, the Company has included a series of clear decarbonisation targets, which aim to reduce Scope 1 and Scope 2 emissions by 50% by 2030 compared to 2018. Added to this is the commitment to reduce methane emissions, strengthening the target previously set for 2025 from -40% (compared to 2016 values) to -45% compared to 2015, with an intermediate target of -36% by 2023 compared to 2015. The reduction target and the baseline year of the natural gas target are in line with the UNEP (United Nations Environment Programme) protocol on the reduction of methane emissions issued by the Oil & Gas Methane Partnership – OGMP, a voluntary initiative that Snam joined in November 2020. In addition, an investment plan has been defined that will allow for the maintenance and development of programmes to recover more than 40% of natural gas from maintenance activities as an average over 5 years, for each year until 2023. These reductions will contribute to the ambitious ultimate goal of achieving carbon neutrality by 2040, ahead of European and national targets.
Although energy consumption remained in line with 2019, total GHG emissions decreased by 13% in 2020 compared to 2019, thanks to reduction measures concerning, in particular, the recovery of natural gas emissions, the use of green electricity and energy efficiency measures, which, together, made it possible to avoid atmospheric emissions of more than 200 thousand tonnes of CO2eq (+12% compared to 2019).
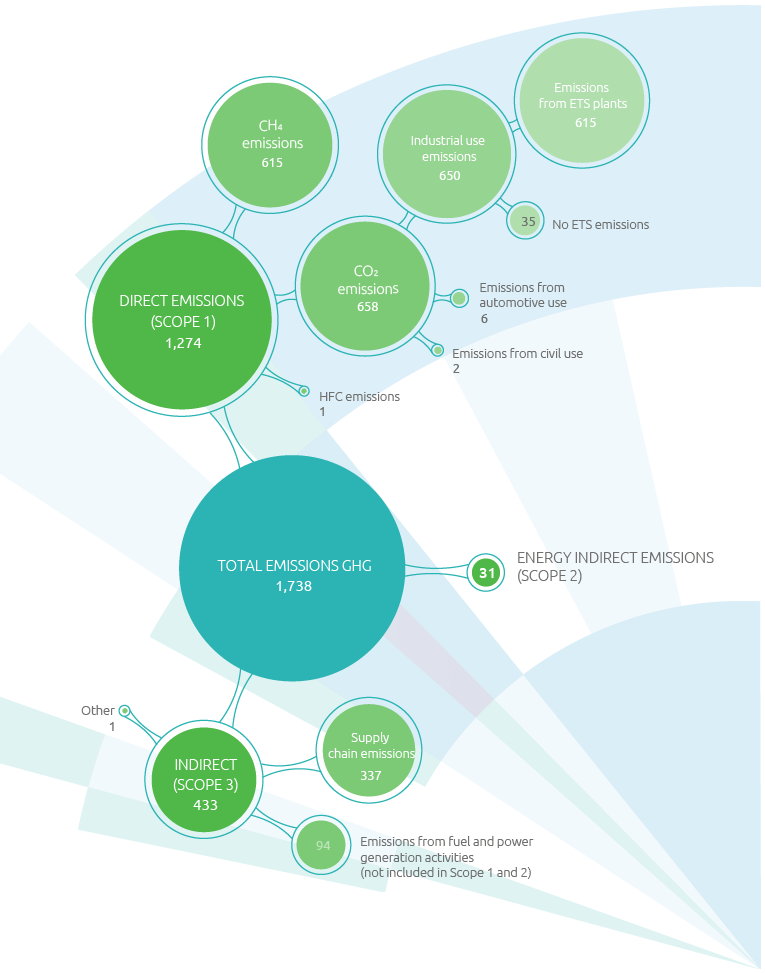
In line with international GHG emissions reporting methods, Snam divides and analyses its emissions into direct (Scope 1), indirect energy (Scope 2) and other indirect emissions (Scope 3), which correspond respectively to emissions from the use of natural gas and other fuels, electricity and heat consumption and all other emissions released along the Company’s value chain, such as those from the supply chain or business travel.
GHG emissions ktCO2eq